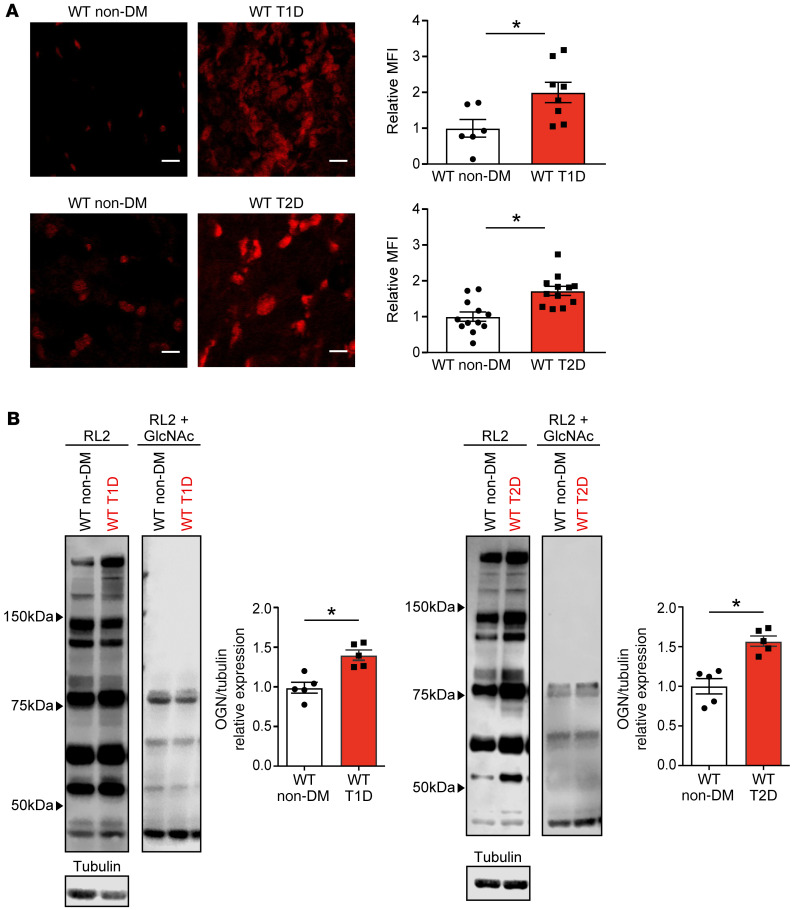
Figure 2. ROS and O-GlcNAcylation are elevated in type 1 and type 2 diabetic hearts.
(A) Representative confocal images (original magnification, ×40) and summary data for DHE fluorescence in mouse atrial tissue show increased ROS in T1D (top) and T2D (bottom). Scale bars: 10μm (n = 6 WT non-DM, n = 8 WT T1D, n = 4 WT non-DM, n = 4 WT T2D) (B) Representative Western blots and summary data for total OGN modified protein levels (OGN monoclonal antibody – RL2) normalized to tubulin and competition assay (RL2 + 500 mM GlcNAc) from heart lysates, from T1D (left) and T2D (right) (n = 3–7/group). OGN quantification excluded the noncompeted bands. DHE, dihydroethidium; DM, diabetes mellitus; T1D, type 1 DM; T2D, type 2 DM; OGN, O-GlcNAcylation. Data are represented as mean ± SEM. Statistical comparisons were performed using 2-tailed Student’s t test (A and B) (*P < 0.05 vs. WT non-DM).

