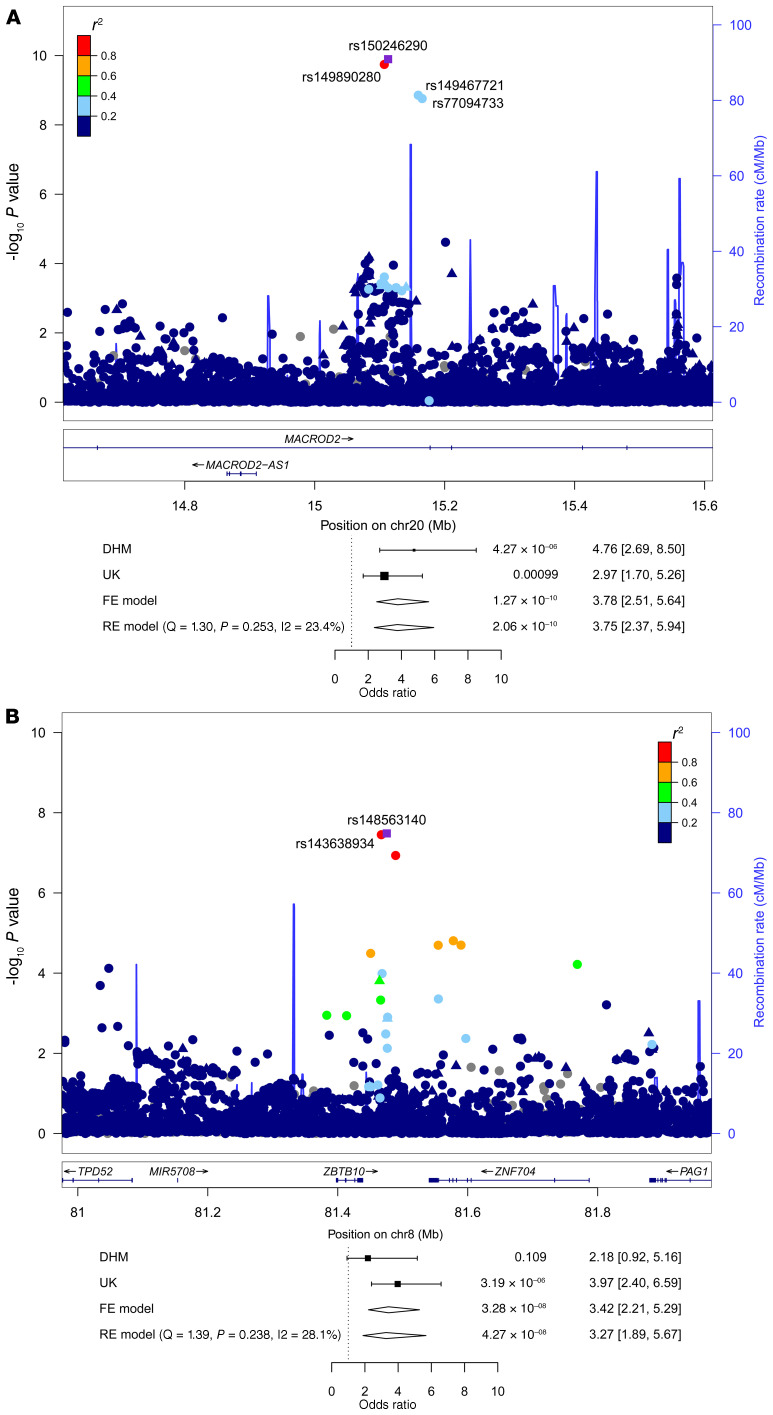
Figure 2. SNPs associated with TGA.
(A) LocusZoom plot of the MACROD2 region on chromosome 20. (B) LocusZoom plot of the ZBTB10 region on chromosome 8. The index SNPs are indicated by purple diamonds, and the other SNPs are color coded depending on their degree of correlation (r2). Circles represent imputed SNPs and triangles genotyped SNPs. Patients with TGA, n = 399. –log10 P values were determined by association statistics from the GWAS (logistic regression).

