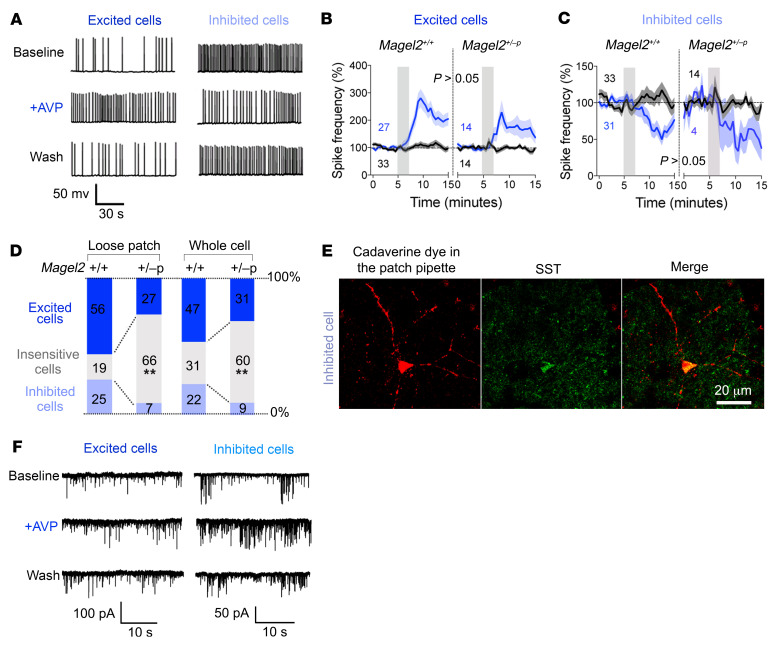
Figure 4. Magel2 deficiency reduces neuronal response to AVP in the dorsal LS.
(A) Typical firing patterns of dorsal LS neurons in coronal slices at baseline and upon 2-minute bath application of 1 μM AVP (whole cell recordings). Responses representative of more than 5 experiments reverted to baseline after washout. (B) Frequency of action potentials in AVP-excited cells. Mean ± SEM expressed as percentage relative to baseline prior to AVP stimulation (gray bar). Numbers indicate cells excited (blue) and insensitive to AVP (black). Three-way ANOVA for time F30,2259 = 9.5, P < 0.0001; AVP F1,76 = 16.9, P < 0.0001; genotype F1,76 = 1.2, P > 0.2; time × AVP F30,2259 = 8.6, P < 0.0001; time × AVP × genotype F30,2259 = 1.04, P = 0.4; post hoc Tukey test. (C) Frequency of action potentials in AVP-inhibited cells. Mean ± SEM expressed as percentage relative to baseline. Numbers indicate cells excited (blue) and insensitive to AVP (black, same as in panel B). Three-way ANOVA for time F30,2077 = 2.55, P < 0.0001; AVP F1,71 = 4.9, P = 0.03; genotype F1,71 = 0.6, P > 0.4; time × AVP F30,2077 = 3.05, P < 0.0001; time × AVP × genotype F30,2077 = 0.4, P > 0.9; post hoc Tukey test. (D) Proportion of cells categorized according to their responses to AVP on the frequency of action potentials recorded in loose patch (n = 32 Magel2+/+, 26 Magel2+/–p cells) or whole cell (n = 103 Magel2+/+, 45 Magel2+/–p cells) configurations. Comparisons between Magel2+/+ and Magel2+/–p: χ2(2) = 11.47, **P = 0.003 and χ2(2) = 13.22, **P = 0.0013. (E) AVP-inhibited cell representative of at least 2 independent experiments marked with cadaverine dye injected in the patch pipette and labeled with SST antibodies. (F) Effect of AVP on the frequency of synaptic events in dorsal LS neurons from Magel2+/+ mice representative of more than 5 experiments. Effect sizes are presented in Table 1.

