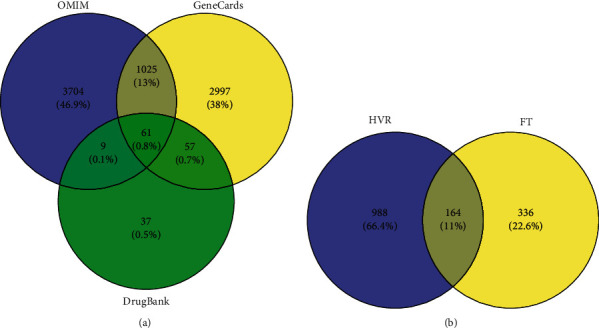
Figure 1.

Venn diagram of related targets of FT in treating HVR. (a) The purple circle represents the targets of HVR from OMIM. The yellow circle represents the targets of HVR from GeneCards. The green circle represents the targets of HVR from DrugBank. (b) The purple circle represents the targets of HVR. The yellow circle represents the targets of the active compounds from FT.
