Figure 2.

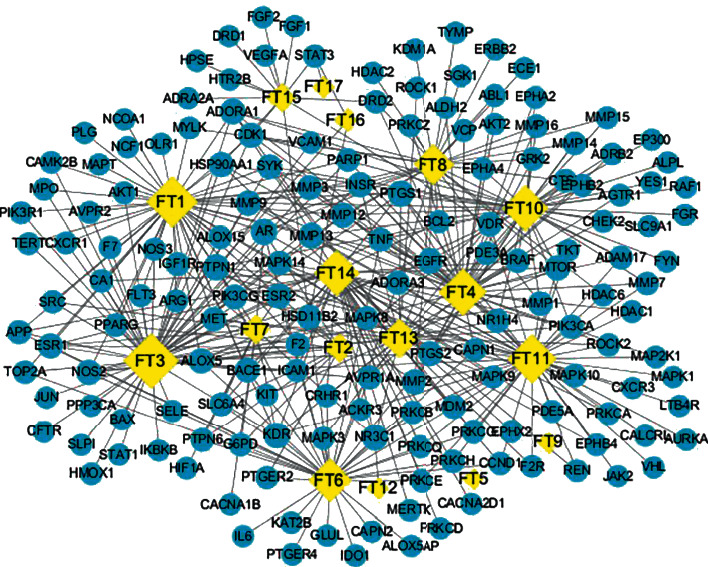
Compound-target interaction network. The yellow nodes represent the compounds, the blue nodes represent the targets, and the edges represent the interaction between them.

Compound-target interaction network. The yellow nodes represent the compounds, the blue nodes represent the targets, and the edges represent the interaction between them.