Figure 3.

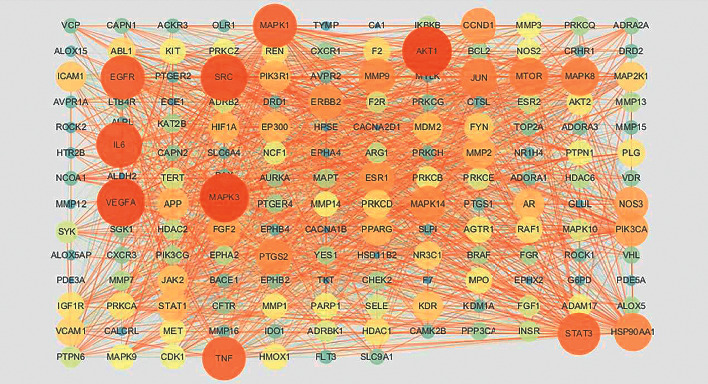
PPI network of FT in the treatment of HVR. The proteins with higher degrees are shown by larger nodes and brighter colors, and the edges with a greater combined score are shown by thicker and brighter lines.

PPI network of FT in the treatment of HVR. The proteins with higher degrees are shown by larger nodes and brighter colors, and the edges with a greater combined score are shown by thicker and brighter lines.