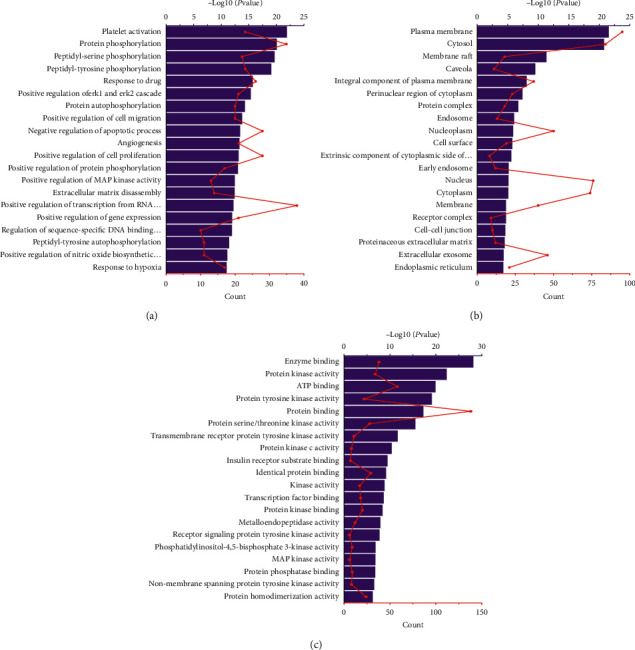
Figure 5.

Results of GO enrichment analysis of the potential targets. (a) Biological processes. (b) Cellular components. (c) Molecular functions. The y-axis shows significantly enriched categories of the targets and the x-axis shows the −log10 (P value) and enrichment counts of each term (P < 0.05).
