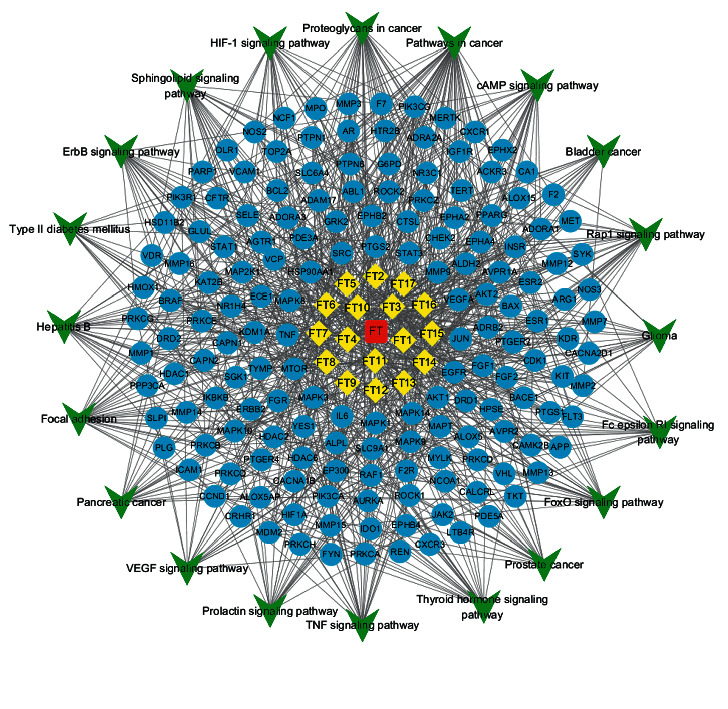
Figure 7.

Compound-target-pathway network. The red nodes represent the drug. The yellow nodes represent the compounds. The blue nodes represent the targets. The green nodes represent the pathway of FT in the treatment of HVR. The edges represent the interaction between them.
