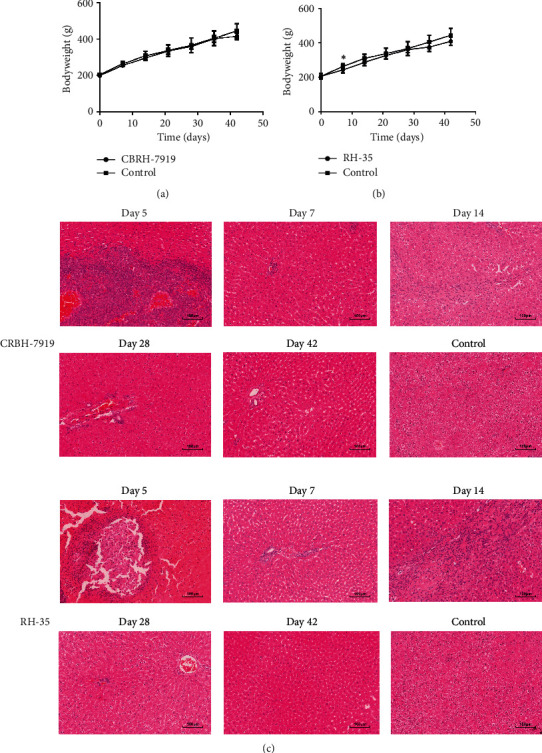
Figure 1.

BW and histopathological characterization of the two models. (a) Change in BW in the CBRH-7919 model (CBRH-7919 group: n = 7; control group: n = 8). (b) Change in BW in the RH-35 model (RH-35 group: n = 8; control group: n = 8). ∗P value < 0 : 05. (c) H&E staining of a control rat and two model rats.
