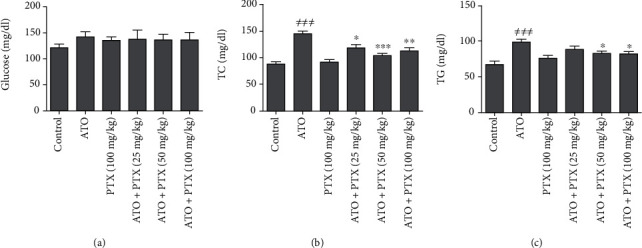
Figure 1.

Effect of PTX on glucose and lipid serum levels in ATO-exposed mice. Statistical analysis used one-way ANOVA with Tukey's test. The results are expressed as means ± SEM, n = 6 for each group. ≠≠≠P < 0.001 vs. control group; ∗P < 0.05, ∗∗P < 0.01, and ∗∗∗P < 0.001 vs. ATO group. Glucose (a); TC: total cholesterol (b); TG: total triglyceride (c); ATO: arsenic trioxide (equal 5 mg/kg); PTX: pentoxifylline.
