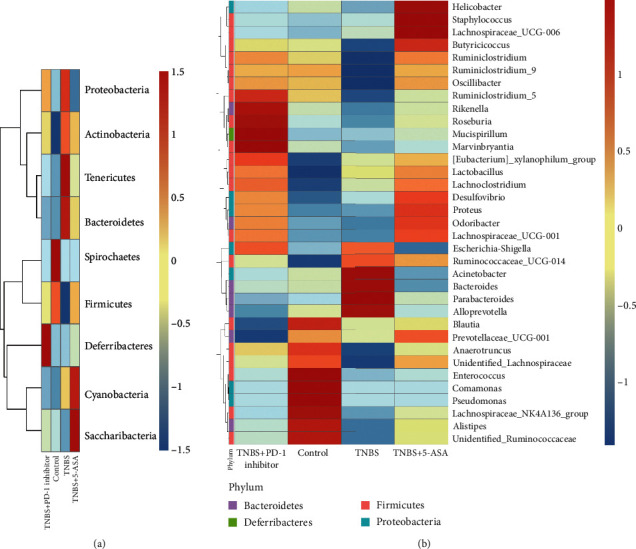
Figure 4.

Cluster heat map analysis of the (a) top nine predictive operational taxonomic units (OTUs) at the phylum level and (b) top 35 predictive OTUs at the genus level. Blue indicates a negative correlation, and red indicates a positive correlation. The X-axis indicates the sample information, and the Y-axis contains the annotation information for the species. The tree on the left indicates species clustering.
