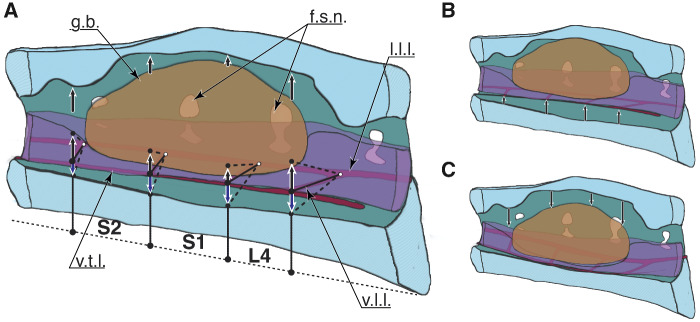
Fig. 5.
Potential for soft tissue movement and the resulting ligament deformation, schematic illustration. (A) Soft tissue in the (A) resting, (B) upper, and (C) lower position. Red indicates the transverse ligaments. Black arrows show up- and down-movements of the glycogen body, the spinal cord tissue, and the ligament nodes. The nodes are defined as the intersection of the ventral transverse and ventral longitudinal ligaments. The dashed lines show the ventral transverse ligaments when deformed.

