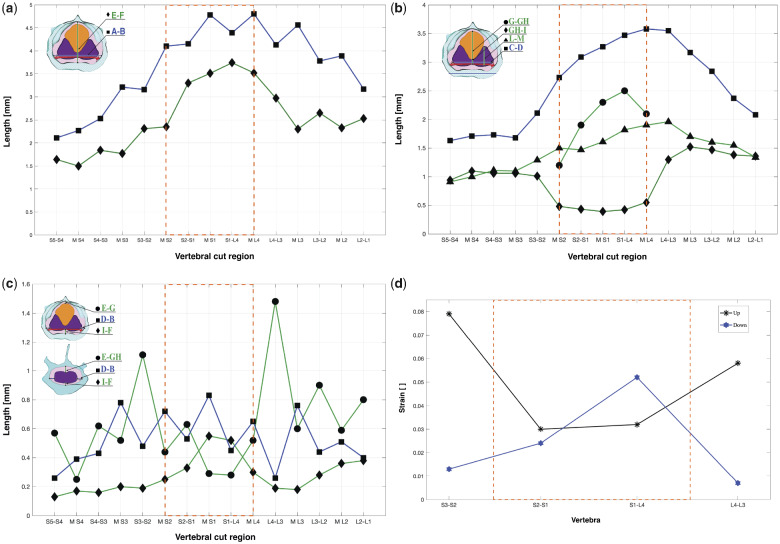
Fig. 6.
(a) Height and width of the spinal canal by spinal segment. A-B (blue curve, square markers): spinal canal width. E-F (green curve, diamond markers): spinal canal height. (b) Morphometrics of the neural soft tissue. C-D spinal cord width with square markers, G-GH glycogen body height with circle markers; GH-I middle of the spinal cord height shown with triangle markers, L-M spinal cord hemisphere height, diamond markers. (c) CSF space morphometry. E-G vertical distance between the glycogen body top and the spinal canal dorsal (circle markers), E-GH vertical distance between the spinal cord and the spinal canal dorsal in the range outside the glycogen body (circle markers), I-F vertical distance between the spinal cord ventral surface and the spinal canal (diamond markers), D-B horizontal, lateral distance between spinal cord and the spinal canal (square markers). (d) Strain estimates of the transverse ligaments at their maximum ventral and dorsal positions of the spinal cord, in reference to their resting position. Asterisk markers (black line) show the maximal transverse ligament strain at the dorsal position, and hexagram markers (blue line) indicate maximal strain in the ventral position.

