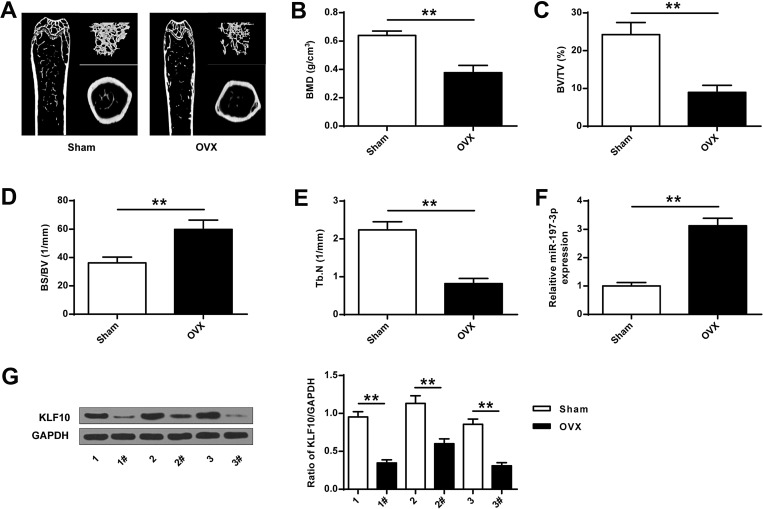
Figure 1.
MiR-197-3p and KLF10 expression in ovariectomized osteoporosis rat models. (A) representative micro-CT images of the right femur. (B) Bone mineral density (BMD) of femoral tissue. (C) Micro-CT analysis of TV/TV in OVX and Sham groups. (D) Micro-CT analysis of BS/BV in OVX and Sham rats. (E) Micro-CT analysis of Tb.N in OVX and Sham groups. (F). MiR-197-3p expression in femoral tissue of OVX and Sham groups. (G) Protein expression of KLF10 in femoral tissue of OVX and Sham groups. N = 3. ** P <0.01.

