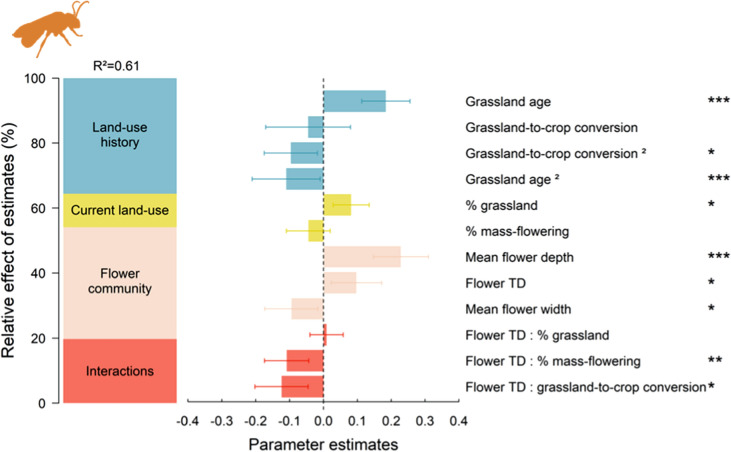
Fig. 2.
Relative effects of estimates (%) of each group of predictors (i.e. land-use history, current land use and flower community) and their interactions on bee trait diversity (hypervolume, sd3) and parameter estimates (± SE) resulting from the model averaging procedure. ‘Flower TD’ is the abbreviation for ‘Flower trait diversity’. P-values of the best selected models for each model parameter are given, *P-value < 0.05; **P-value < 0.01; ***P-value < 0.001. Bee trait diversity and flower trait diversity (hypervolumes, sd3) were log-transformed and all variables were scaled. See also Table S8 for details on model selection and Table S9

