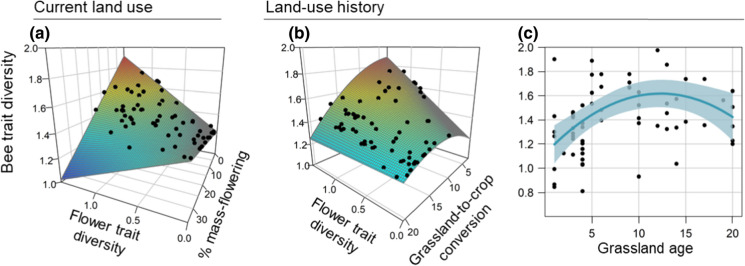
Fig. 3.
Significant effects of a flower trait diversity interacting with the percentage of mass-flowering crops in the landscape; b flower trait diversity interacting with grassland-to-crop conversion, and c age of the grassland on bee trait diversity. The colour gradient in panels a and b corresponds to bee trait diversity values, ranging from low values (blue) to high values (red). Black dots show the overall gradients in flower trait diversity, the percentage of mass-flowering crops in the landscape, the landscape grassland-to-crop conversion and the grassland age for the 66 grasslands. The shaded area in panel c indicates the 95% confidence intervals. Bee trait diversity and flower trait diversity (hypervolumes, sd3) were scaled and log-transformed

