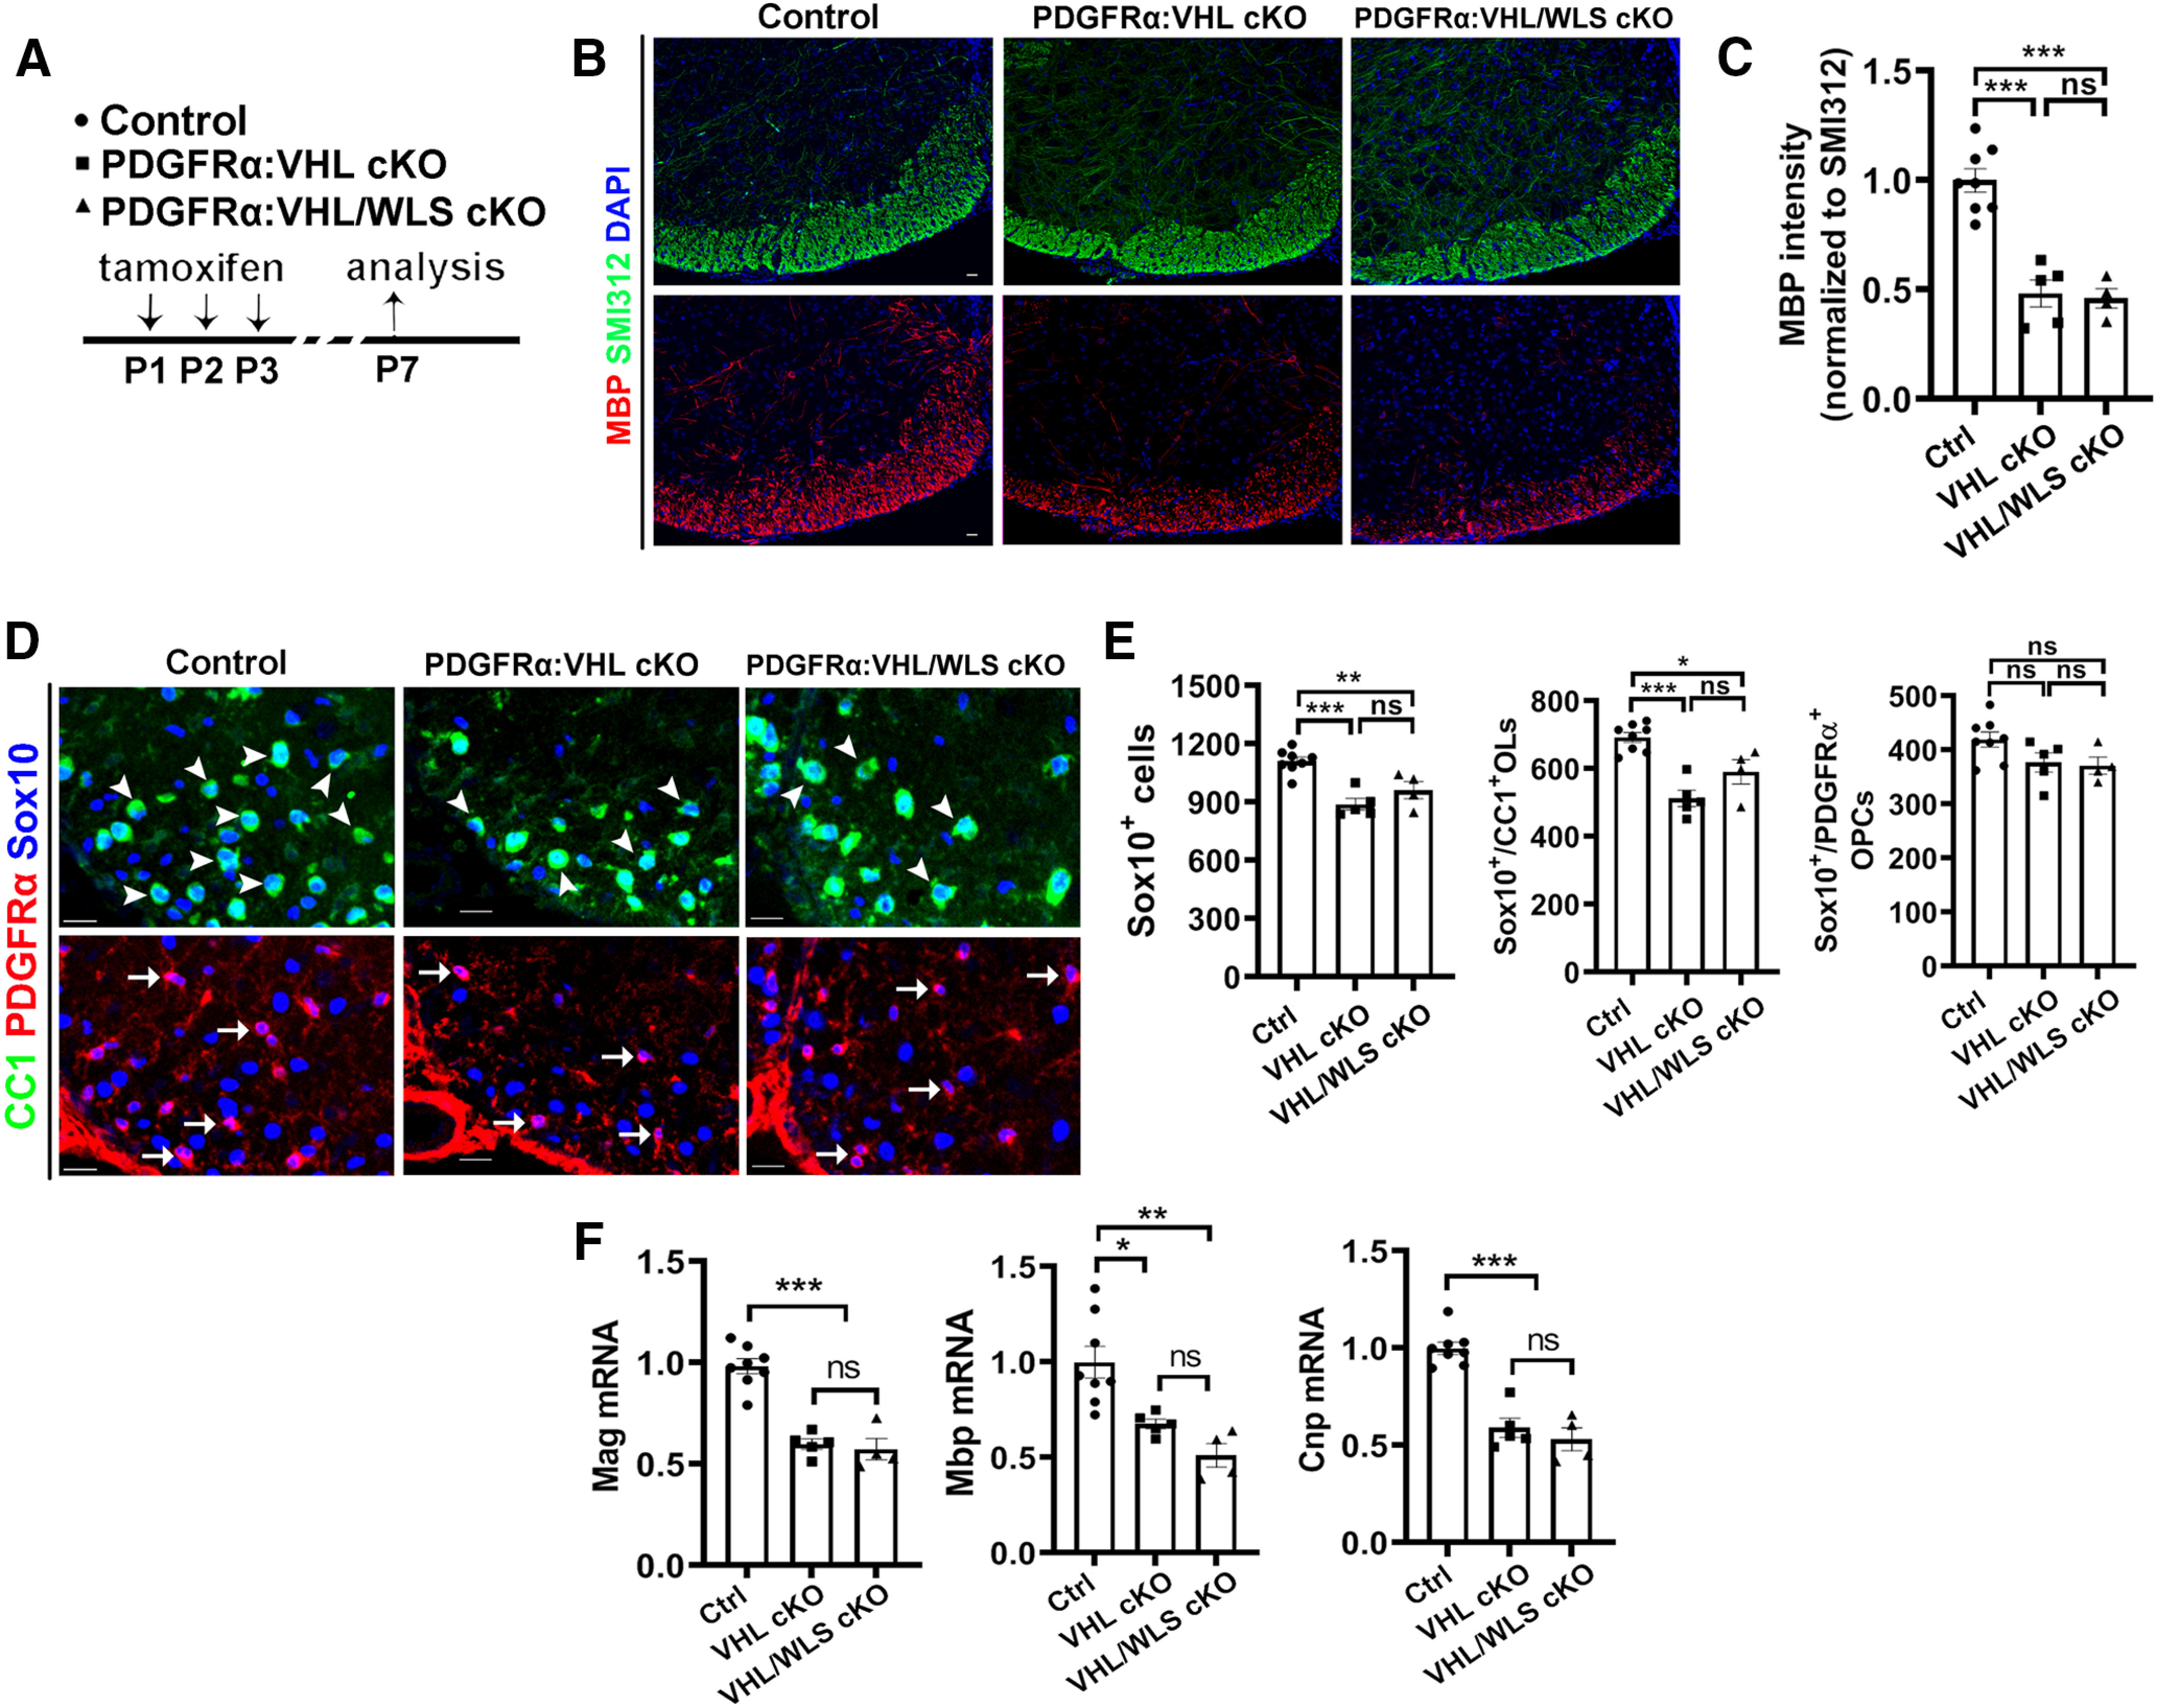
Figure 8.

Disrupting WLS in PDGFRα-expressing OPCs does not affect the degree of inhibited OPC differentiation and hypomyelination elicited by HIFα hyperactivation. A, Experimental design for B–F. PDGFRα:VHL cKO, Pdgfrα-CreERT2:Vhlfl/fl (n = 5); PDGFRα:VHL/WLS cKO, Pdgfrα-CreERT2:Vhlfl/fl:Wlsfl/fl (n = 4); non-Cre Ctrl carrying Vhlfl/fl and/or Wlsfl/fl (n = 8). B, C, Representative confocal images (B) and quantification of myelination (C) by MBP staining. The signal of SMI312, a pan-axonal marker is indistinguishable among each group and used as an internal control of MBP quantification. One-way ANOVA followed by Tukey's multiple-comparisons test: F(2, 14)=31.93 p < 0.0001. D, E, Representative confocal images (D) and quantification (E) of Sox10+/CC1+ differentiated OLs (D, arrowheads), Sox10+/PDGFRα+ OPCs (D, arrows), and Sox10+ oligodendroglial lineage cells in the spinal cord. One-way ANOVA followed by Tukey's multiple-comparisons test: Sox10+, F(2,14) = 17.34, p = 0.0002; Sox10+/CC1+, F(2,14) = 18.44, p = 0.0001; Sox10+/PDGFRα+, F(2,14) = 2.967, p = 0.0843. F, qRT-PCR quantification of mature OL-enriched genes in the spinal cord. One-way ANOVA followed by Tukey's multiple-comparisons test: Mbp, F(2,14) = 11.53, p = 0.0011; Mag, F(2,14) = 39.88, p < 0.0001; Cnp, F(2,14) = 38.78, p < 0.0001. Scale bars: B, D, 20 µm.
