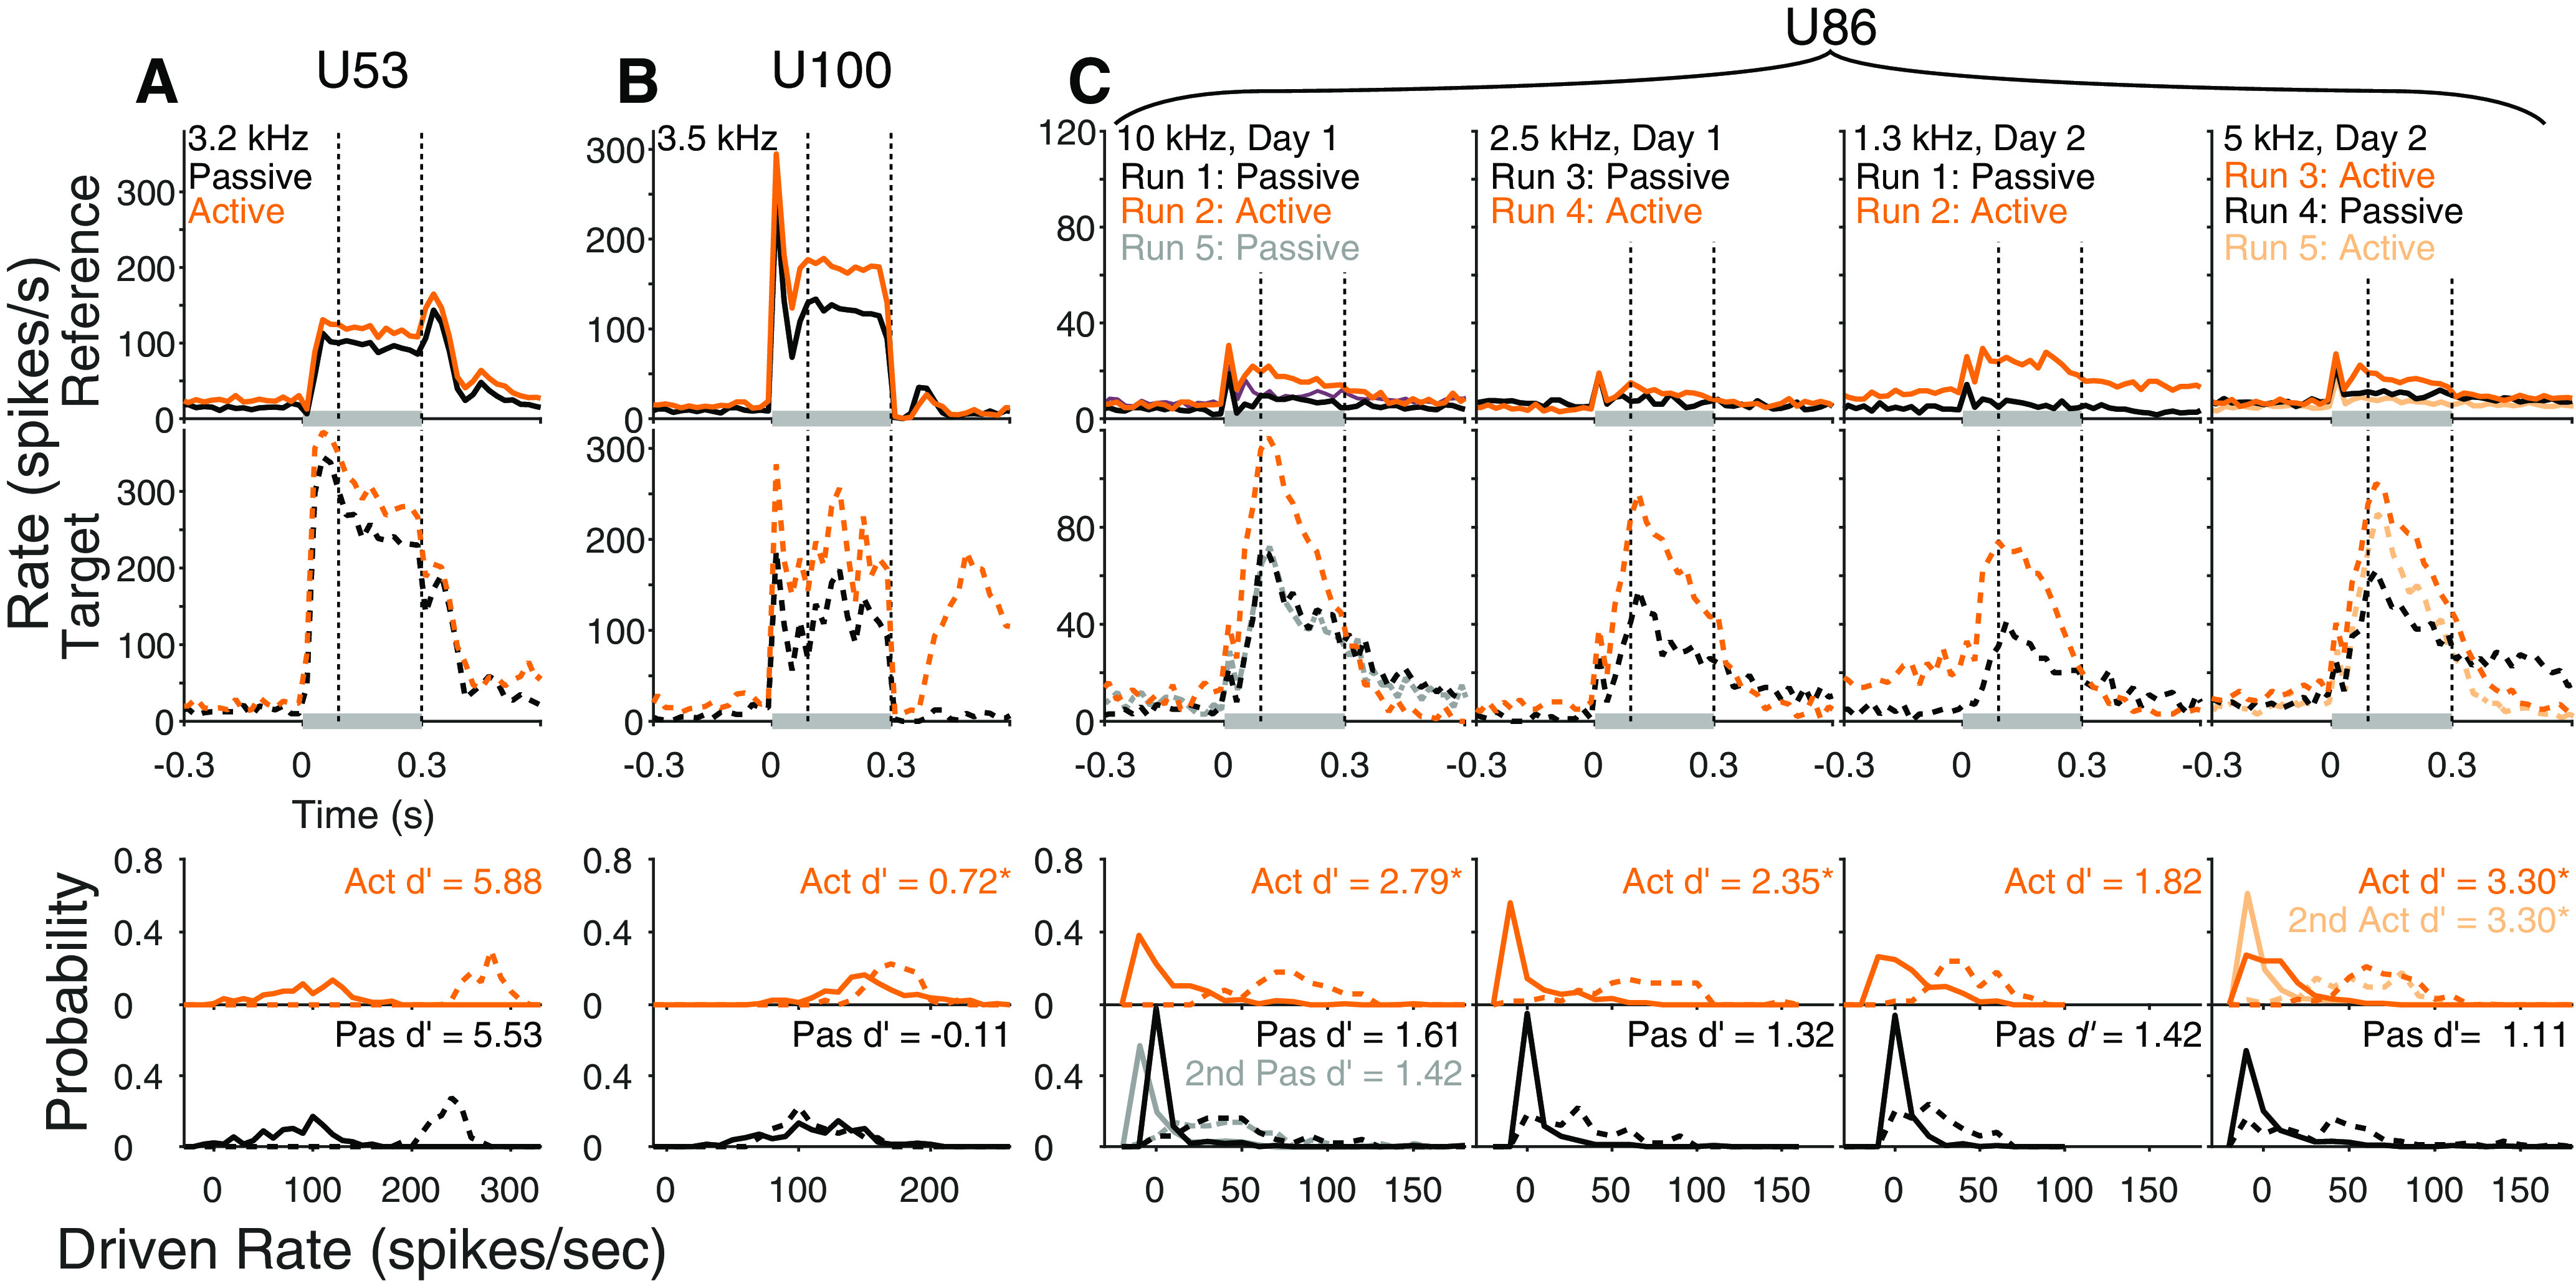
Figure 2.

Example task engagement effects on reference and target responses. Top, Peristimulus time histograms (PSTHs) of rate in response to references in passive (black) and active (orange) blocks. Gray bars represent stimulus duration. Dashed lines indicate analysis window. Titles indicate the unit number assigned to our database (“Unn”). Middle, PSTHs in response to targets. Bottom, Histogram of mean driven response rates to references (solid) and targets (dashed) for passive and active conditions. Numbers indicate neural d′ between reference and target. *Significant difference (p < 0.05, jackknife t test). A, Data for ICC neuron exhibiting no significant task engagement effects (BF 3.2 kHz). B, Data for ICC neuron exhibiting mild task engagement effects (BF 3.5 kHz). C, Data for AM neuron exhibiting strong task engagement effects (BF not defined, not tuned). Each column plots responses for different target frequencies and days, as noted. In row 1, a second passive was recorded. In row 4, an active recording was made first, followed by a passive and another active.
