Figure 6.

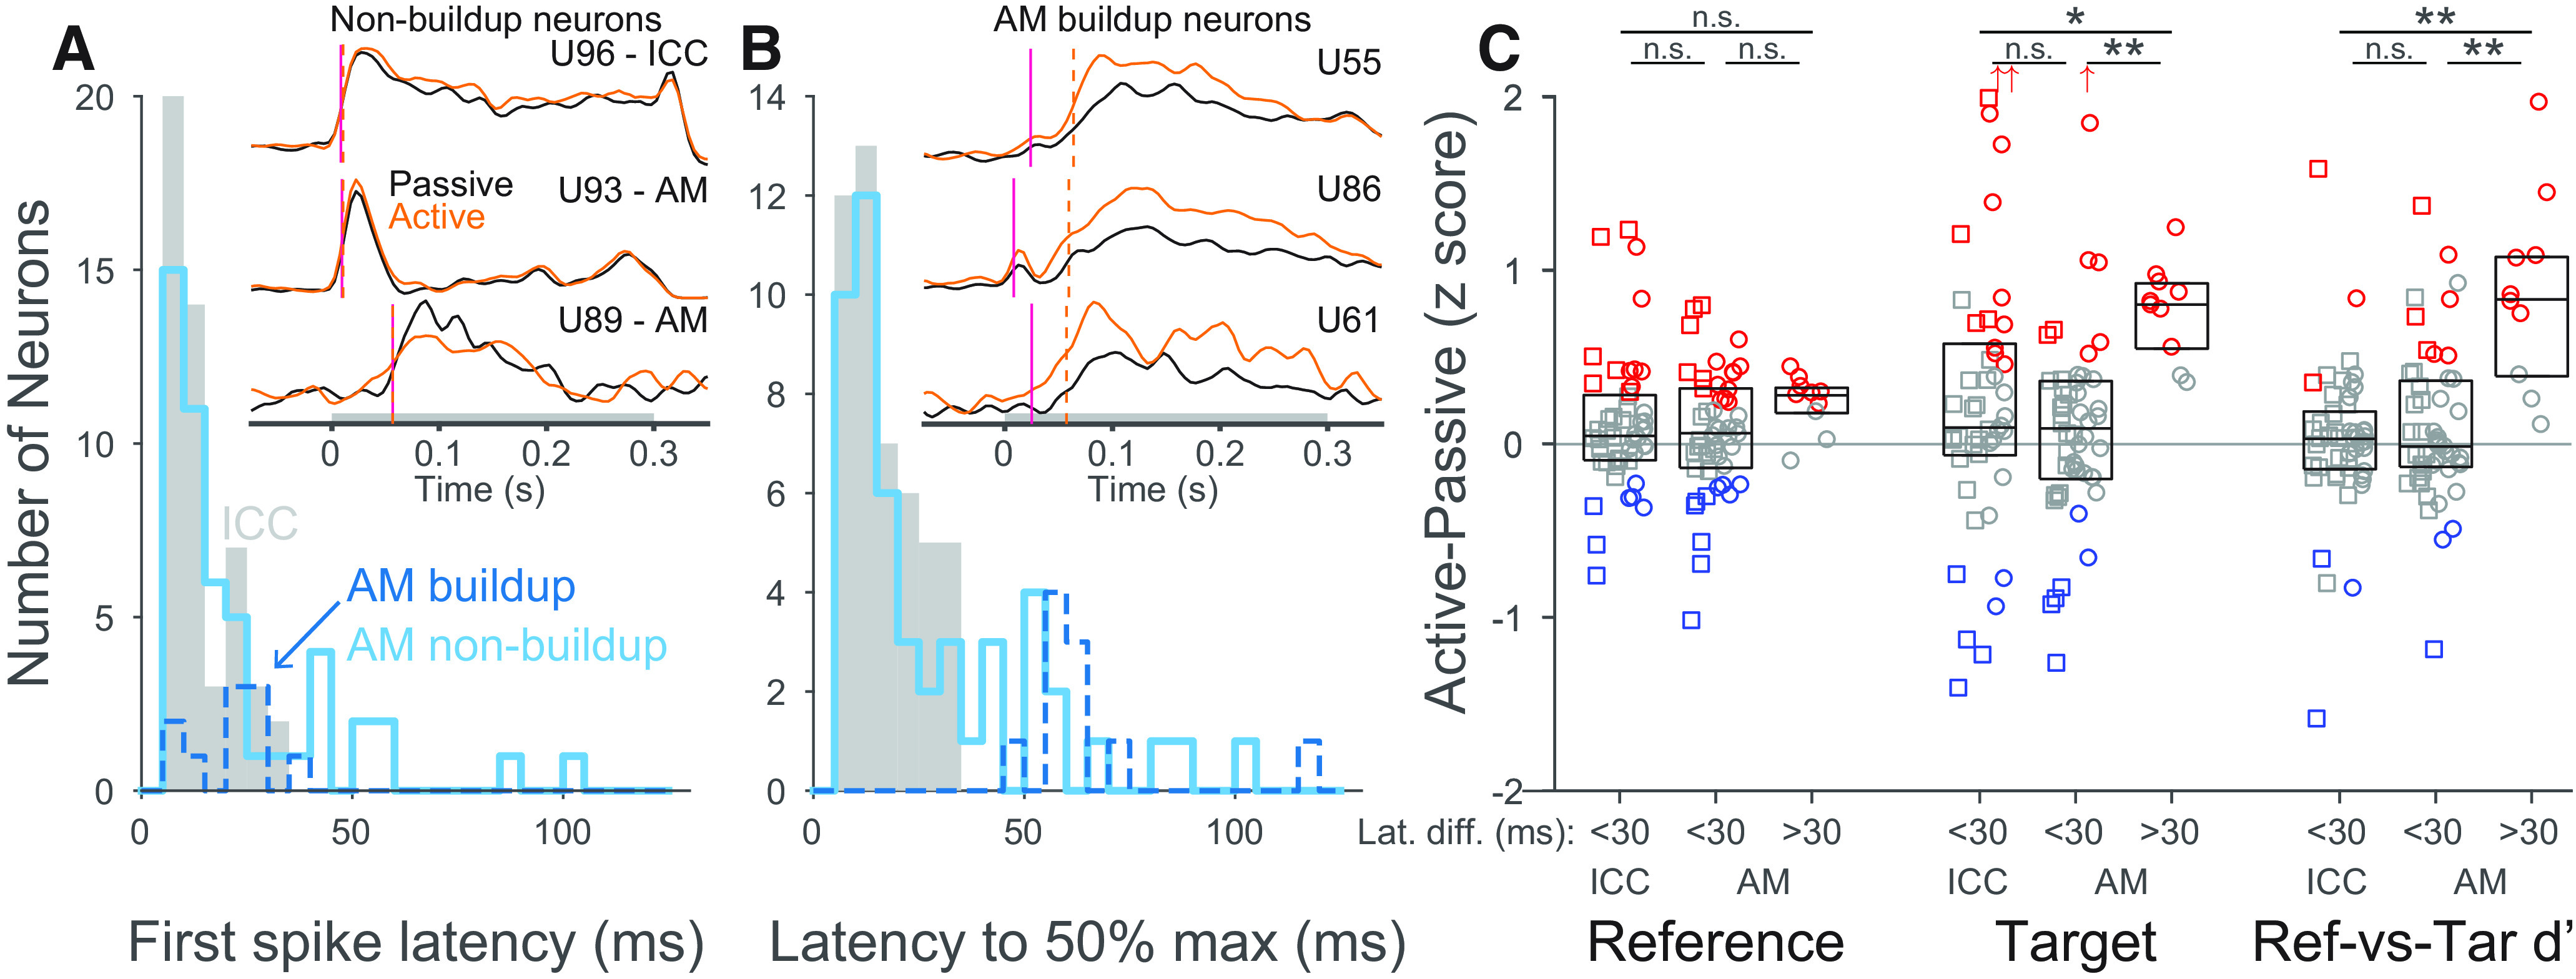
AM neurons with slow, buildup responses show strong enhancement of target responses during behavior. A, Histogram of first-spike response latency and (B) latency to 50% of maximum response to targets during the active block for ICC (gray), nonbuildup AM (light blue), and buildup AM (dark blue, dashed) neurons. Buildup neurons were defined as having a latency to 50% maximum driven rate > 30 ms longer than their first-spike latency. These buildup responses only occurred outside of ICC. Insets, PSTH responses to targets for 6 example neurons, nonbuildup neurons in A and buildup neurons in B. Magenta lines indicate first-spike latency. Dashed orange lines indicate latency to 50% maximum response. Gray bar represents target duration. C, Task-related changes in reference, target, and target-reference d′ in neurons grouped by buildup category (nonbuildup: <30; buildup: >30). Boxes represent median and interquartile range. Significant difference in median: *p < 0.05; **p < 0.001; rank-sum test. Squares represent neurons recorded in Marmoset C. Circles represent neurons recorded in Marmoset F. Off axis points are all from Marmoset F and have values: Target ICC: 2.4, 2.9; Target AM <30 ms: 3.9. n.s. Not significant.
