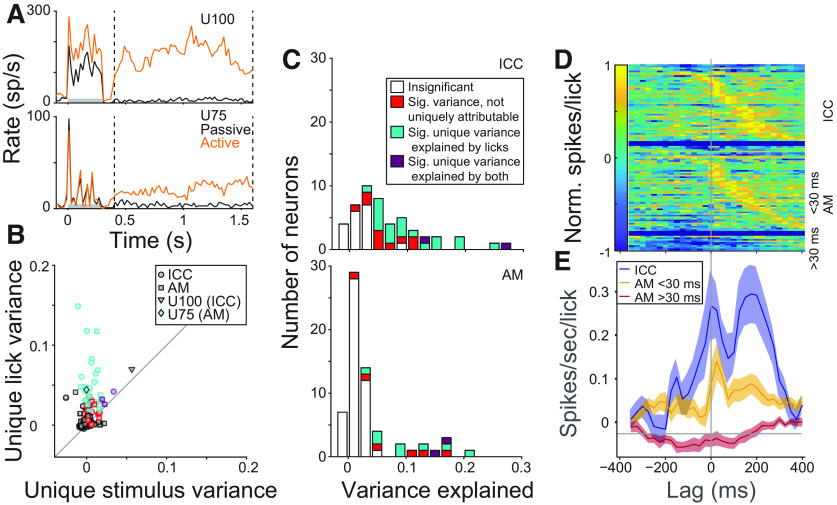
Figure 9.
Post-target spiking activity is predominantly lick-related. A, Mean target responses in an ICC (top) and an AM neuron (bottom), both with substantial post-target spiking. Gray bars represent stimulus duration. Dashed lines indicate analysis window. B, Scatter plot compares variance of single-trial spike rate uniquely attributable to licking versus stimulus for each neuron. Area and significance indicated in legend, color scheme as in C. C, Histogram of variance explained in poststimulus spike rate by full multiple-regression model for ICC neurons (top) and AM neurons (bottom). D, Heat map of lick response functions (coefficients of lick regressor at time lags before and after lick events). Each row represents the function for a single neuron, normalized by maximum absolute value. Rows are sorted by the time of the positive peak and grouped by areas and response latency difference (as in Fig. 6). E, Mean (±SE) lick response functions (not normalized) for ICC neurons (blue), and AM neurons without (yellow) and with buildup responses (red).

