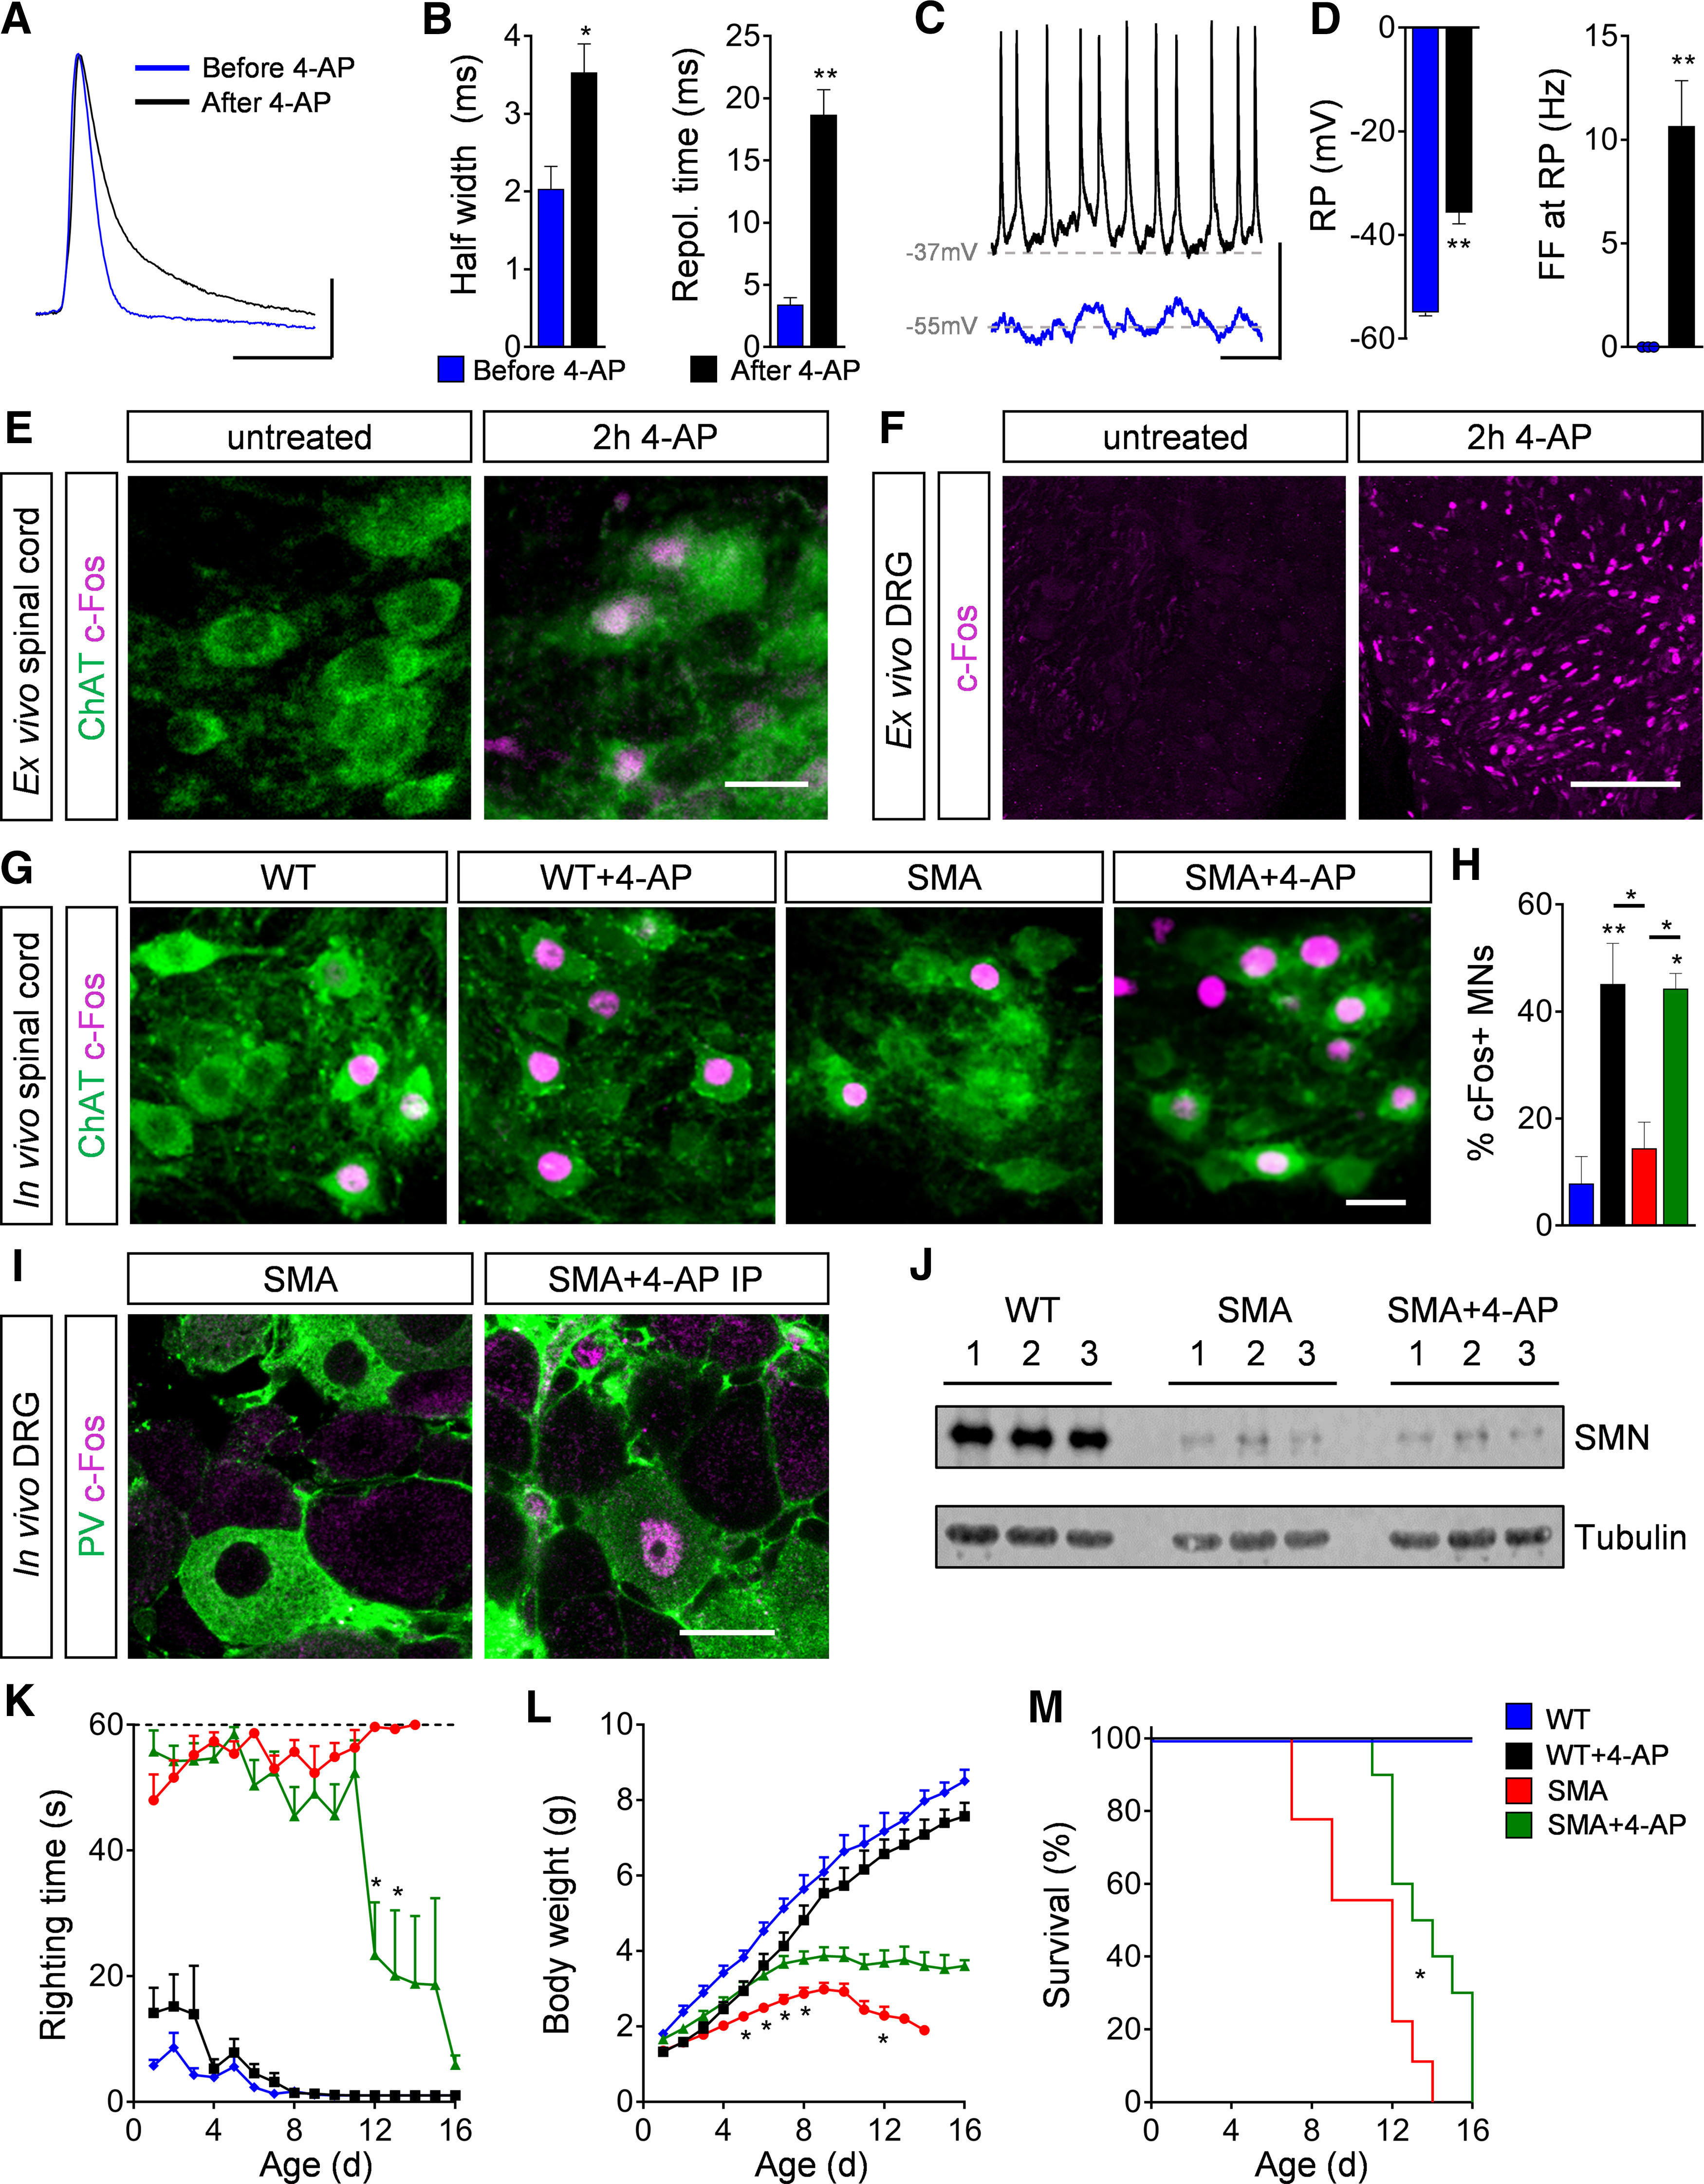
Figure 1.

4-AP increases motor neuron (MN) activity and SMA motor function in vivo. A, Action potential of a P4 WT MN before and after 4-AP (100 μm) exposure to an ex vivo spinal cord preparation. Scale bar: 20 mV, 10 ms. B, Quantification of half width and repolarization time of P4 WT MNs before and after 4-AP exposure ex vivo. Half width in milliseconds: before 4-AP = 2.03 ± 0.29, after 4-AP = 3.53 ± 0.37, n = 3 MNs from 3 spinal cords, p = 0.033, two-tailed t test; Repol. Time in milliseconds: before 4-AP = 3.40 ± 0.57, after 4-AP = 18.67 ± 2.04, n = 3 MNs from 3 spinal cords, p = 0.002, two-tailed t test. C, Spontaneous firing of P4 WT MNs at resting potential (RP) before and after 4-AP treatment. Scale bar: 20 mV, 200 ms. D, Quantification of RP and spontaneous firing frequency (FF) at RP of P4 WT MNs before and after 4-AP treatment. RP in millivolts: before 4-AP = −55 ± 0.58, after 4-AP = −35.67 ± 2.19, n = 3 MNs from 3 spinal cords, p = 0.001, two-tailed t test; FF in Hertz: before 4-AP = 0 ± 0, after 4-AP = 10.67 ± 2.19, n = 3 MNs from 3 spinal cords, p = 0.008, two-tailed t test. E, F, Immunostaining of ChAT+ MNs (green) and c-Fos as neuronal activity marker (magenta) in L1 spinal cord (E) and DRG (F) sections of P4 WT ex vivo spinal cord preparation without and with 2-h 4-AP (100 μm) exposure. Scale bar: 30 µm (for spinal cord) and 100 µm (for DRG). G, Immunostaining of ChAT+ MNs (green) and c-Fos as neuronal activity marker (magenta) in L1 spinal cord sections from WT and SMA mice without and with acute 4-AP intraperitoneal injections (WT, WT + 4-AP, SMA, and SMA + 4-AP) at P11. Scale bar: 25 µm. H, Percentage of c-Fos+ MNs from the same groups as in G. WT (3) = 7.88 ± 5.03 WT + 4-AP (4) = 45.12 ± 7.63, SMA (3) = 14.44 ± 4.87, SMA + 4-AP (3) = 44.25 ± 2.88, p for WT versus WT + 4-AP = 0.006, p for WT versus SMA + 4-AP = 0.011, p for WT + 4-AP versus SMA p = 0.020, p for SMA versus SMA + 4-AP = 0.033, one-way ANOVA with Tukey's correction. Number of mice is reported in parentheses. I, Immunostaining of PV+ proprioceptive neurons (green) and c-Fos (magenta) in L1 DRG sections from P11 SMA and SMA + 4-AP mice. Scale bar: 20 µm. J, Western blot analysis of SMN and tubulin (loading control) protein levels in the spinal cord of WT, SMA, and SMA + 4-AP at P11. K–M, Righting time (K), body weight (L), and Kaplan–Meyer analysis of survival (M) from the same groups as in (G) with chronic 4-AP treatment. Number of mice for WT = 7, WT + 4-AP = 11, SMA = 12, SMA + 4-AP = 18; righting time: SMA n = 12 (P7), 11 (P8), 9 (P11), 6 (P12), 3 (P13), 1 (P14); SMA + 4-AP n = 18 (P10), 12 (P11), 7 (P12), 6, (P13), 5 (P14), 4 (P15), 3 (P16); p for SMA versus SMA + 4-AP indicate with asterisks at P12 = 0.002 and P13 = 0.036; body weight: p for SMA versus SMA + 4-AP indicate with asterisk at P5 = 0.034, P6 = 0.024, P7 = 0.019, P8 = 0.049, and P12 = 0.049, multiple t test with Holm–Sidak method; Kaplan–Meyer analysis: p for SMA versus SMA + 4-AP = 0.014 indicated with asterisk, Mantel–Cox test. Data are presented as mean ± SEM. Asterisks on top of bars without a horizontal line indicate the significance compared with the WT group; *p < 0.05, **p < 0.01, ***p < 0.001.
