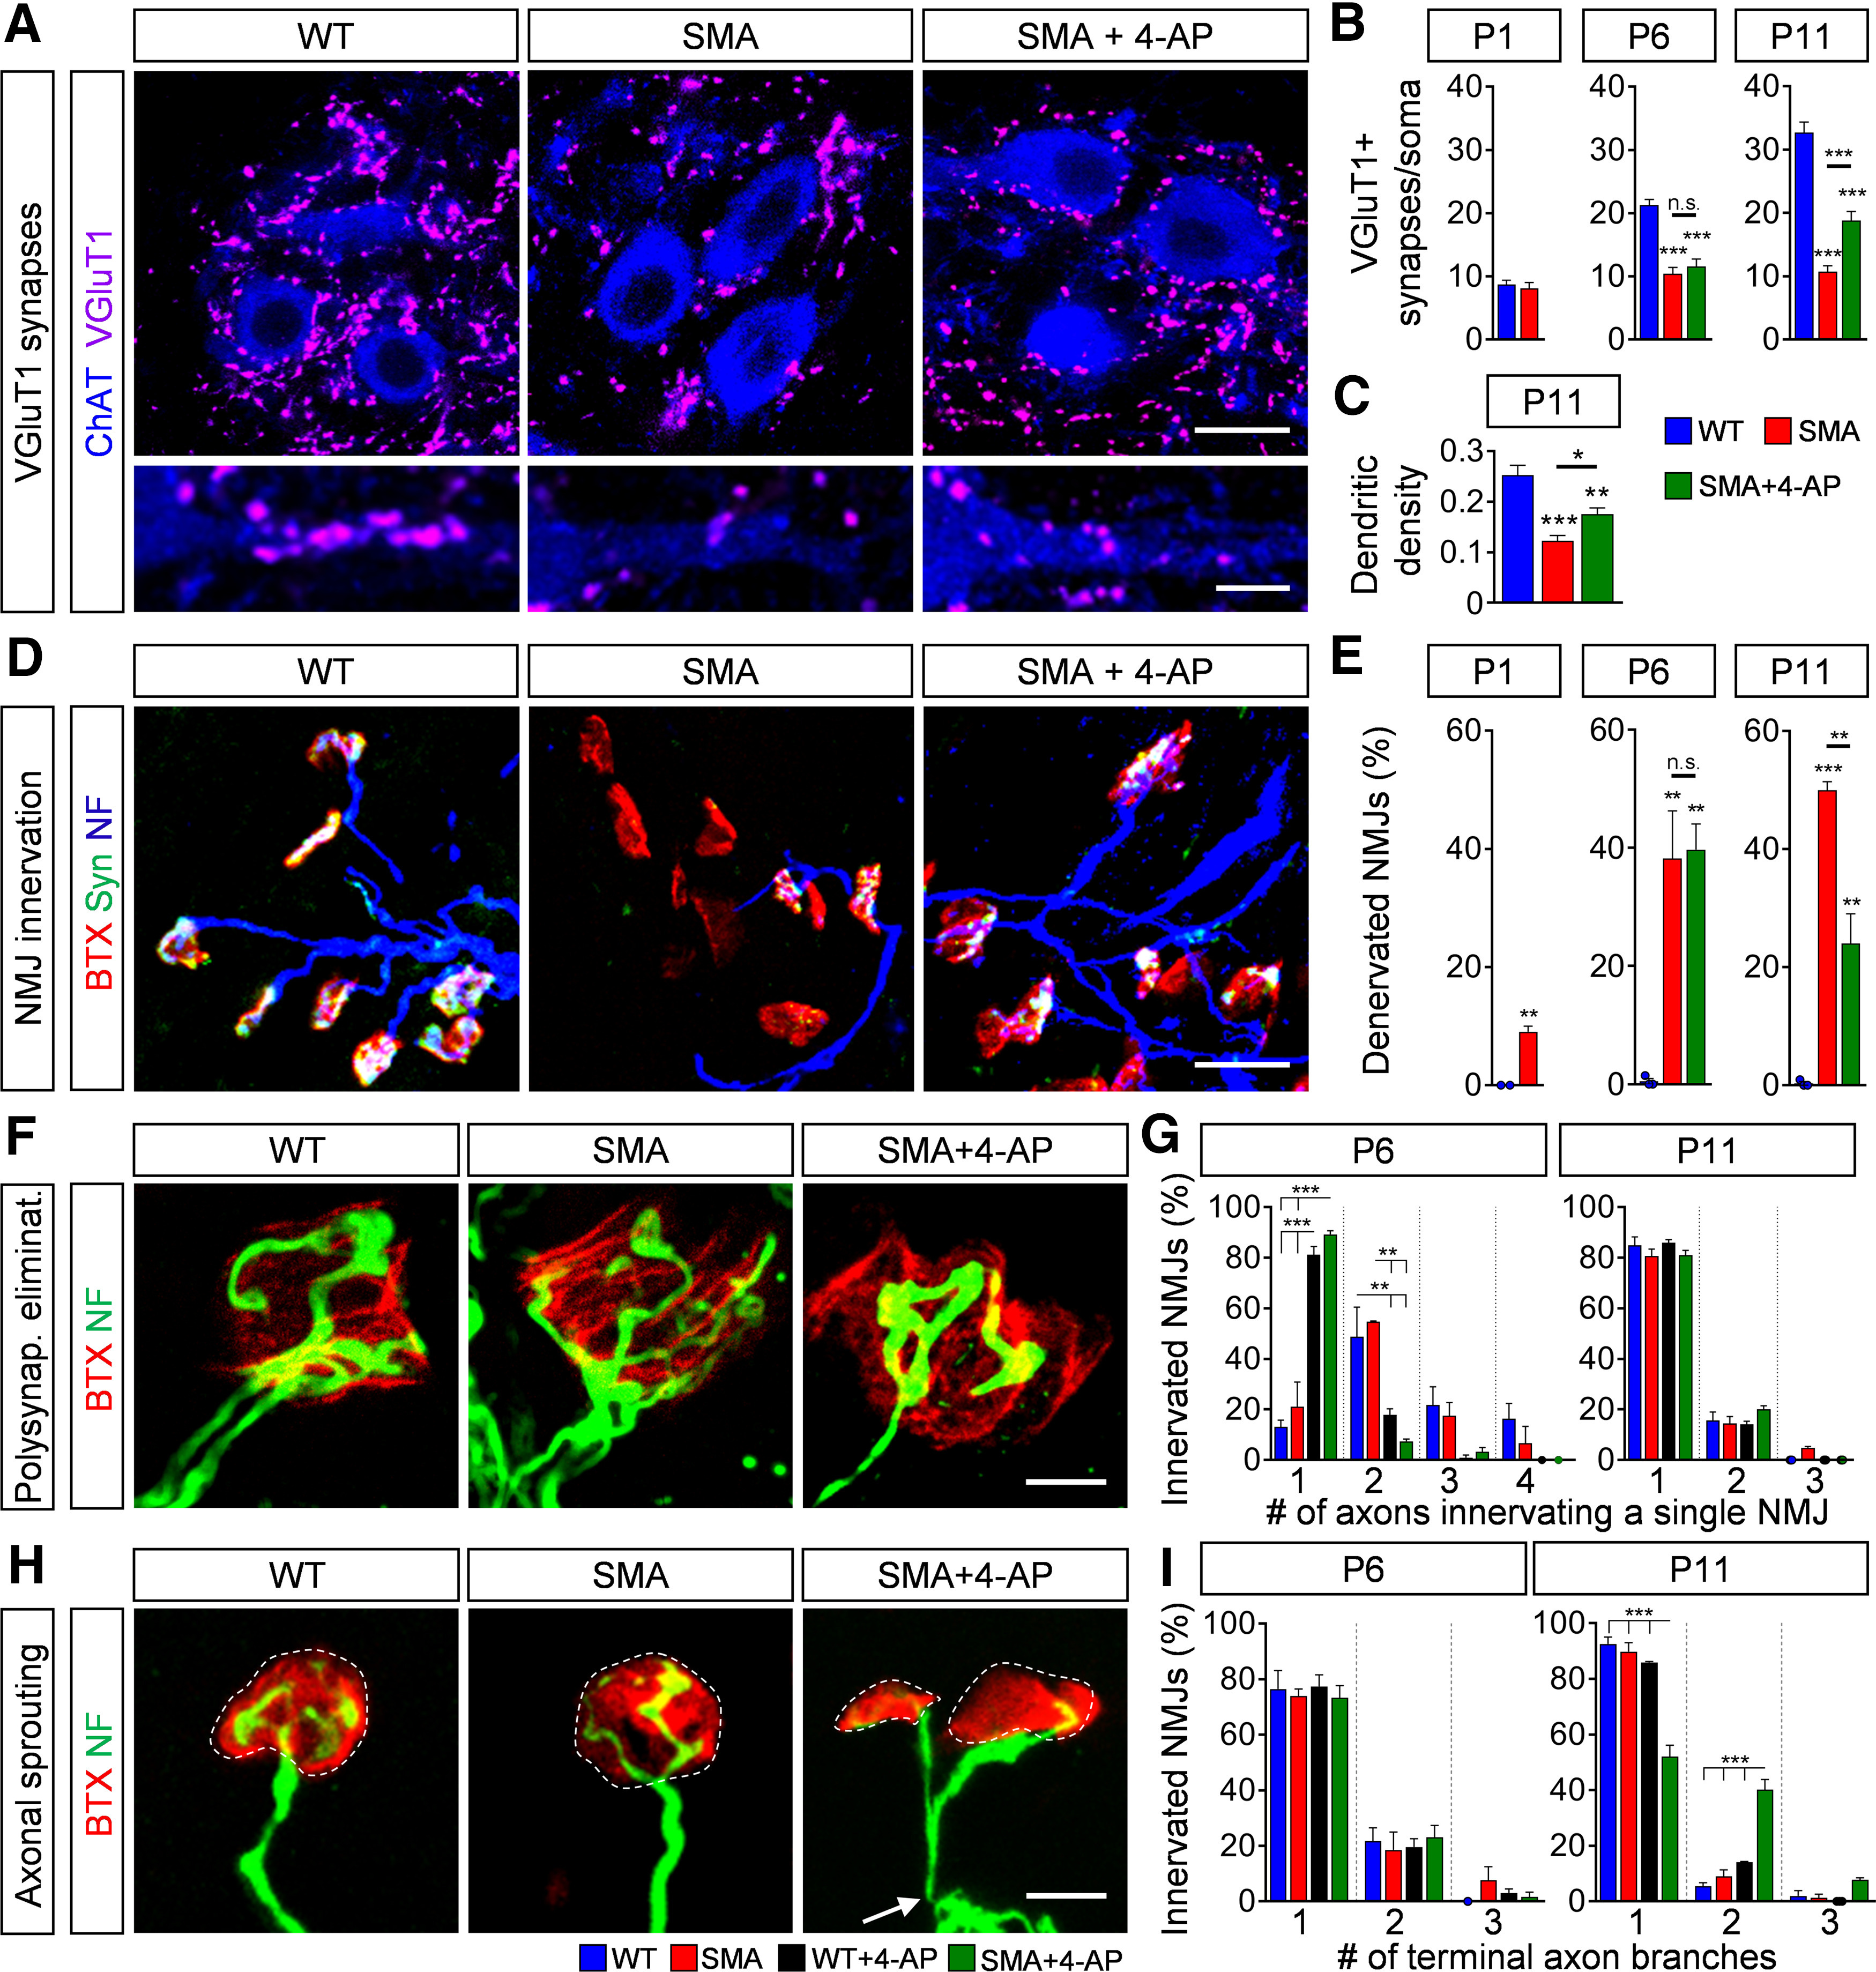
Figure 3.

4-AP restores synaptic connections via sprouting in the SMA sensory-motor circuit. A, Immunostaining of VGluT1+ synapses (magenta) on ChAT+ motor neuron (blue) somata (upper panel) and proximal dendrites (lower panel) in L1 spinal cord sections from WT, SMA, and SMA + 4-AP mice at P11. Scale bar: 20µm (upper panel) and 10 µm (lower panel). B, Number of VGluT1+ synapses on the somata of L1 motor neurons from the same groups as A at P1, P6, and P11. P1: WT (10) = 8.7 ± 0.68, SMA (10) = 8.1 ± 0.92, p = 0.6082, two-tailed t test; P6: WT (12) = 21.25 ± 0.90, SMA (10) = 10.4 ± 1.03, SMA + 4-AP (16) = 11.56 ± 1.19, p for WT versus SMA < 0.0001, p for WT versus SMA + 4-AP < 0.0001, one-way ANOVA with Tukey's correction; P11: WT (14) = 32.71 ± 1.66, SMA (14) = 10.71 ± 0.96, SMA + 4-AP (15) = 18.8 ± 1.45, p for WT versus SMA < 0.0001, p for WT versus SMA + 4-AP < 0.0001, p for SMA versus SMA + 4-AP = 0.0005, one-way ANOVA with Tukey's correction. Number of motor neurons from three mice is reported in parentheses. C, Number of VGluT1+ synapses on the proximal dendrites (0–50 µm from soma) of L1 ChAT+ motor neurons from the same groups as A at P11. WT (12) = 0.253 ± 0.019, SMA (16) = 0.123 ± 0.011, SMA + 4-AP (10) = 0.176 ± 0.012, p for WT versus SMA < 0.0001, p for WT versus SMA + 4-AP = 0.003, p for SMA versus SMA + 4-AP = 0.035, one-way ANOVA with Tukey's correction. Number of motor neurons from three mice is reported in parentheses. D, NMJ staining with bungarotoxin (BTX; red), synaptophysin (Syn; green), and neurofilament (NF; blue) of QL muscles from the same groups as in A at P11. Scale bar: 30 µm. E, Quantification of denervated NMJs in the QL muscle of the same groups as in A at P1, P6, and P11. P1: WT (3) = 0 ± 0, SMA (4) = 9.06 ± 0.93, p = 0.0004, two-tailed t test; P6: WT (3) = 0.49 ± 0.49, SMA (3) = 38.21 ± 8.05, SMA + 4-AP (3) = 39.69 ± 8.05, p for WT versus SMA = 0.0056, p for WT versus SMA + 4-AP = 0.0047, one-way ANOVA with Tukey's correction; P11: WT (3) = 0.32 ± 0.32, SMA (4) = 49.96 ± 1.47, SMA + 4-AP (6) = 24.03 ± 5.02, p for WT versus SMA < 0.0001, p for WT versus SMA + 4-AP = 0.0090, p for SMA versus SMA + 4-AP = 0.0028, one-way ANOVA with Tukey's correction. Number of mice is reported in parentheses, >200 NMJs were analyzed per animal. F, High magnification of axons innervating a single NMJ of the QL muscle visualized with NF (green) and BTX (red) from the same groups as in A at P11. Scale bar: 5 µm. G, Proportion of axons innervating a single NMJ in the QL muscle from WT, WT + 4-AP, SMA, and SMA + 4-AP mice at P6 and P11. P6 one axon innervating a single NMJ: WT = 13.1 ± 2.96, SMA = 21.15 ± 9.68, WT + 4-AP = 81.12 ± 3.28, SMA + 4-AP = 89.28 ± 1.47, p for WT versus WT + 4-AP < 0.0001, p for WT versus SMA + 4-AP < 0.0001; p for SMA versus WT + 4AP = 0.0002, p for SMA versus SMA + 4-AP < 0.0001, one-way ANOVA with Tukey's correction; P6 two axons innervating a single NMJ: WT = 48.76 ± 11.73, SMA = 54.62 ± 0.38, WT + 4-AP = 17.78 ± 2.50, SMA + 4-AP = 7.42 ± 0.95, p for WT versus WT + 4-AP = 0.0273, p for WT versus SMA + 4-AP = 0.0055, p for SMA versus SMA + 4-AP = 0.0108, p for SMA versus SMA + 4-AP = 0.0024, one-way ANOVA with Tukey's correction. More than 40 NMJs per animal were analyzed and the mean was formed. Three mice of each group were analyzed. H, High magnification of sprouting events at the NMJs of the QL muscle visualized with NF (green) and BTX (red) from the same groups as in A at P11. White dashed circles mark single NMJs. Arrow indicates a single motor axon. Scale bar: 10 µm. I, Proportion of NMJ innervating terminal branches of a single axon in the QL from the same groups as in G at P6 and P11. P11 one terminal axon branch: WT = 92.53 ± 2.47, SMA = 89.78 ± 3.27, WT + 4-AP = 85.95 ± 0.33, SMA + 4-AP = 52.05 ± 4.13, p for WT versus SMA + 4-AP < 0.0001, p for SMA versus SMA + 4-AP < 0.0001; p for SMA + 4-AP versus WT + 4AP = 0.0002, one-way ANOVA with Tukey's correction; P11 two terminal axon branches: WT = 5.51 ± 1.22, SMA = 8.94 ± 2.39, WT + 4-AP = 14.05 ± 0.33, SMA + 4-AP = 40.13 ± 3.72, p for WT versus SMA-4-AP <0.0001, p for SMA versus SMA + 4-AP <0.0001, p for WT + 4-AP versus SMA + 4-AP = 0.0002, one-way ANOVA with Tukey's correction. More than 40 NMJs per animal were analyzed and the mean was formed. Three mice of each group were analyzed. Data are presented as mean ± SEM. Asterisks on top of bars without a horizontal line indicate the significance compared with the WT group; n.s. = not significant; *p < 0.05, **p < 0.01, ***p < 0.001.
