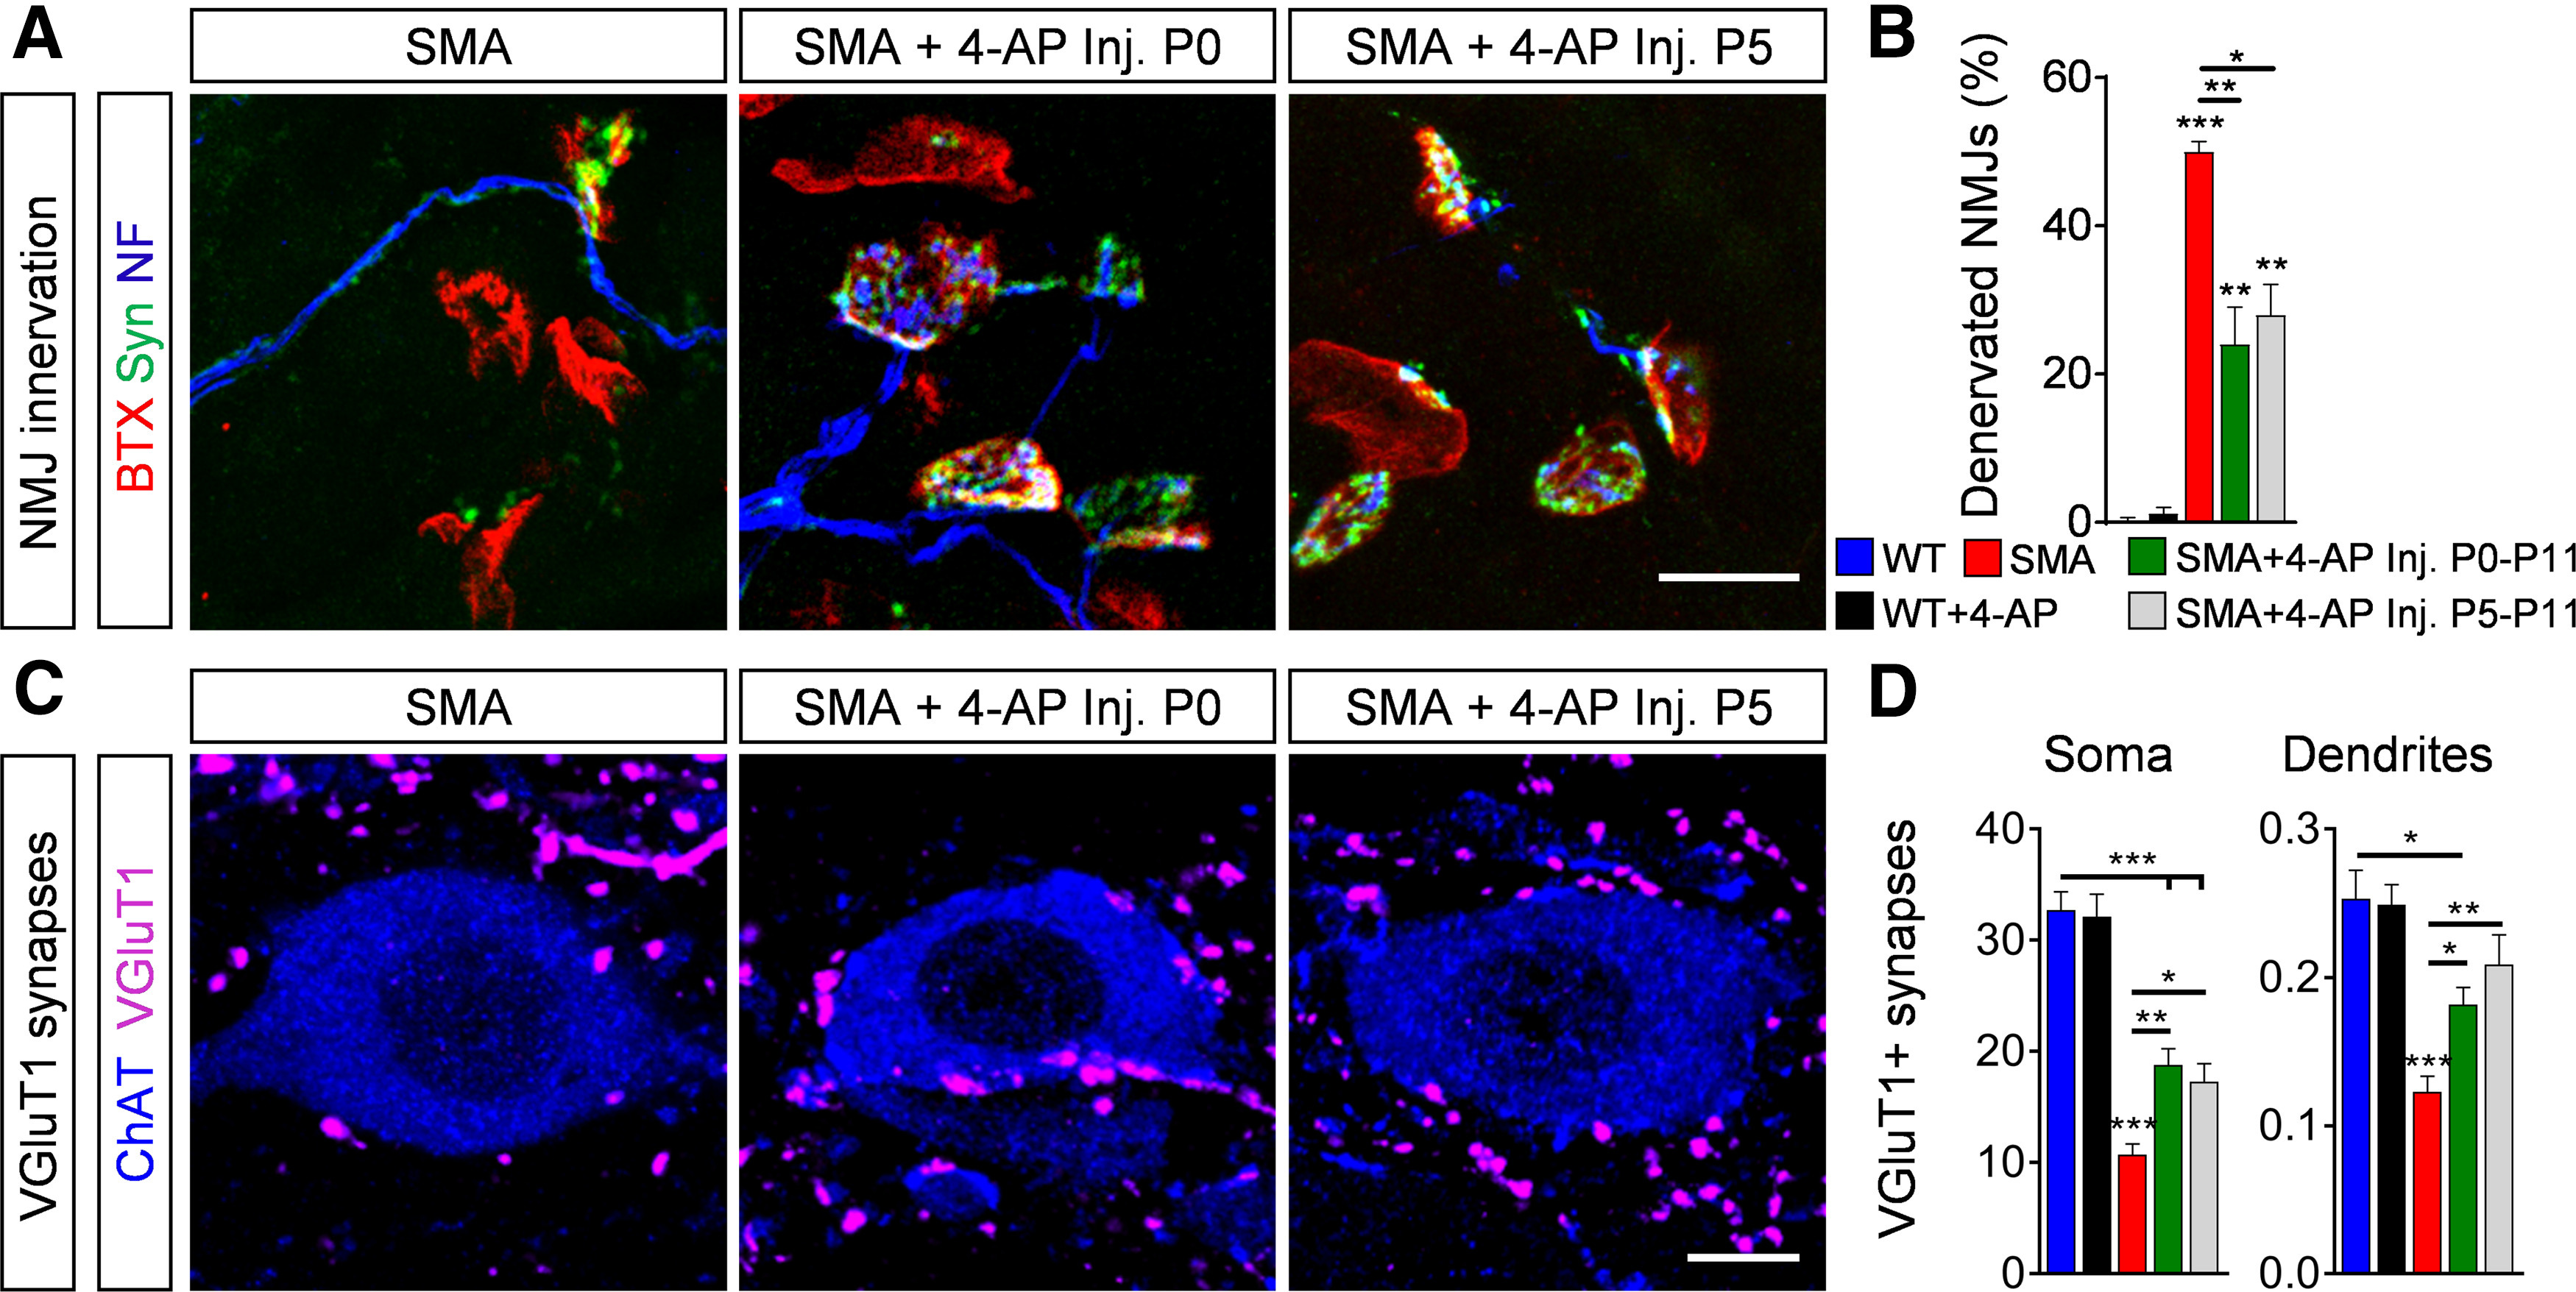
Figure 4.

4-AP-induced synaptic connectivity requires a more mature neuronal network. A, NMJ staining with bungarotoxin (BTX; red), synaptophysin (Syn; green), and neurofilament (NF; blue) in QL muscles from P11 SMA mice and SMA mice with 4-AP injections started at birth until P11 (Inj. P0–P11) or at P5 until P11 (Inj. P5–P11). Scale bar: 20 µm. B, Quantification of denervated NMJs in percent of the QL muscle of P11 WT, WT + 4-AP, SMA, SMA + 4-AP inj. P0–P11 and SMA + 4-AP inj. P5–P11. WT (3) = 0.32 ± 0.32, WT + 4-AP (3) = 1.15 ± 0.83, SMA (4) = 49.96 ± 1.47, SMA + 4-AP P0–P11 (6) = 24.03 ± 5.02, SMA + 4-AP (3) P5–P11 = 27.91 ± 4.19, p for WT versus SMA <0.0001, p for WT versus SMA + 4-AP P0–P11 = 0.0067, p for WT versus SMA + 4-AP P5–P11 = 0.0063, p for SMA versus SMA + 4-AP P0–P11 = 0.0014, p for SMA versus SMA + 4-AP P5–P11 = 0.0198, one-way ANOVA with Tukey's correction. Number of mice is reported in parentheses, >200 NMJs were analyzed per animal. C, Immunostaining of VGluT1+ synapses (magenta) and ChAT+ motor neurons (blue) in L1 spinal cord sections from the same groups as in A. Scale bar: 10 µm. D, Number of VGluT1+ synapses on the somata and proximal dendrites (0–50 µm from the soma) of L1 motor neurons from the same groups as B at P11. Soma: WT (14) = 32.71 ± 1.66, WT + 4-AP (10) = 32.1 ± 2.05, SMA (14) = 10.71 ± 0.96, SMA + 4-AP P0–P11 (15) = 18.8 ± 1.45, SMA + 4-AP (10) P5–P11 = 17.3 ± 1.61, p for WT versus SMA + 4-AP P0–P11 and P5–P11 < 0.0001, p for WT versus SMA <0.0001, p for SMA versus SMA + 4-AP P0–P11 = 0.0018, p for SMA versus SMA + 4-AP P5–P11 = 0.0325, one-way ANOVA with Tukey's correction; dendrites: WT (12) = 0.253 ± 0.019, WT + 4-AP (6) = 0.2 ± 0.013, SMA (16) = 0.1229 ± 0.010, SMA + 4-AP P0–P11 (9) = 0.181 ± 0.012, SMA + 4-AP (6) P5–P11 = 0.208 ± 0.0201, p for WT versus SMA + 4-AP P0–P11 = 0.0144, p for WT versus SMA < 0.0001, p for SMA versus SMA + 4-AP P0–P11 = 0.0444, p for SMA versus SMA + 4-AP P5–P11 = 0.0055, one-way ANOVA with Tukey's correction. Number of motor neurons from three mice is reported in parentheses. Data are presented as mean ± SEM. Asterisks on top of bars without a horizontal line indicate the significance compared with the WT group; *p < 0.05, **p < 0.01, ***p < 0.001.
