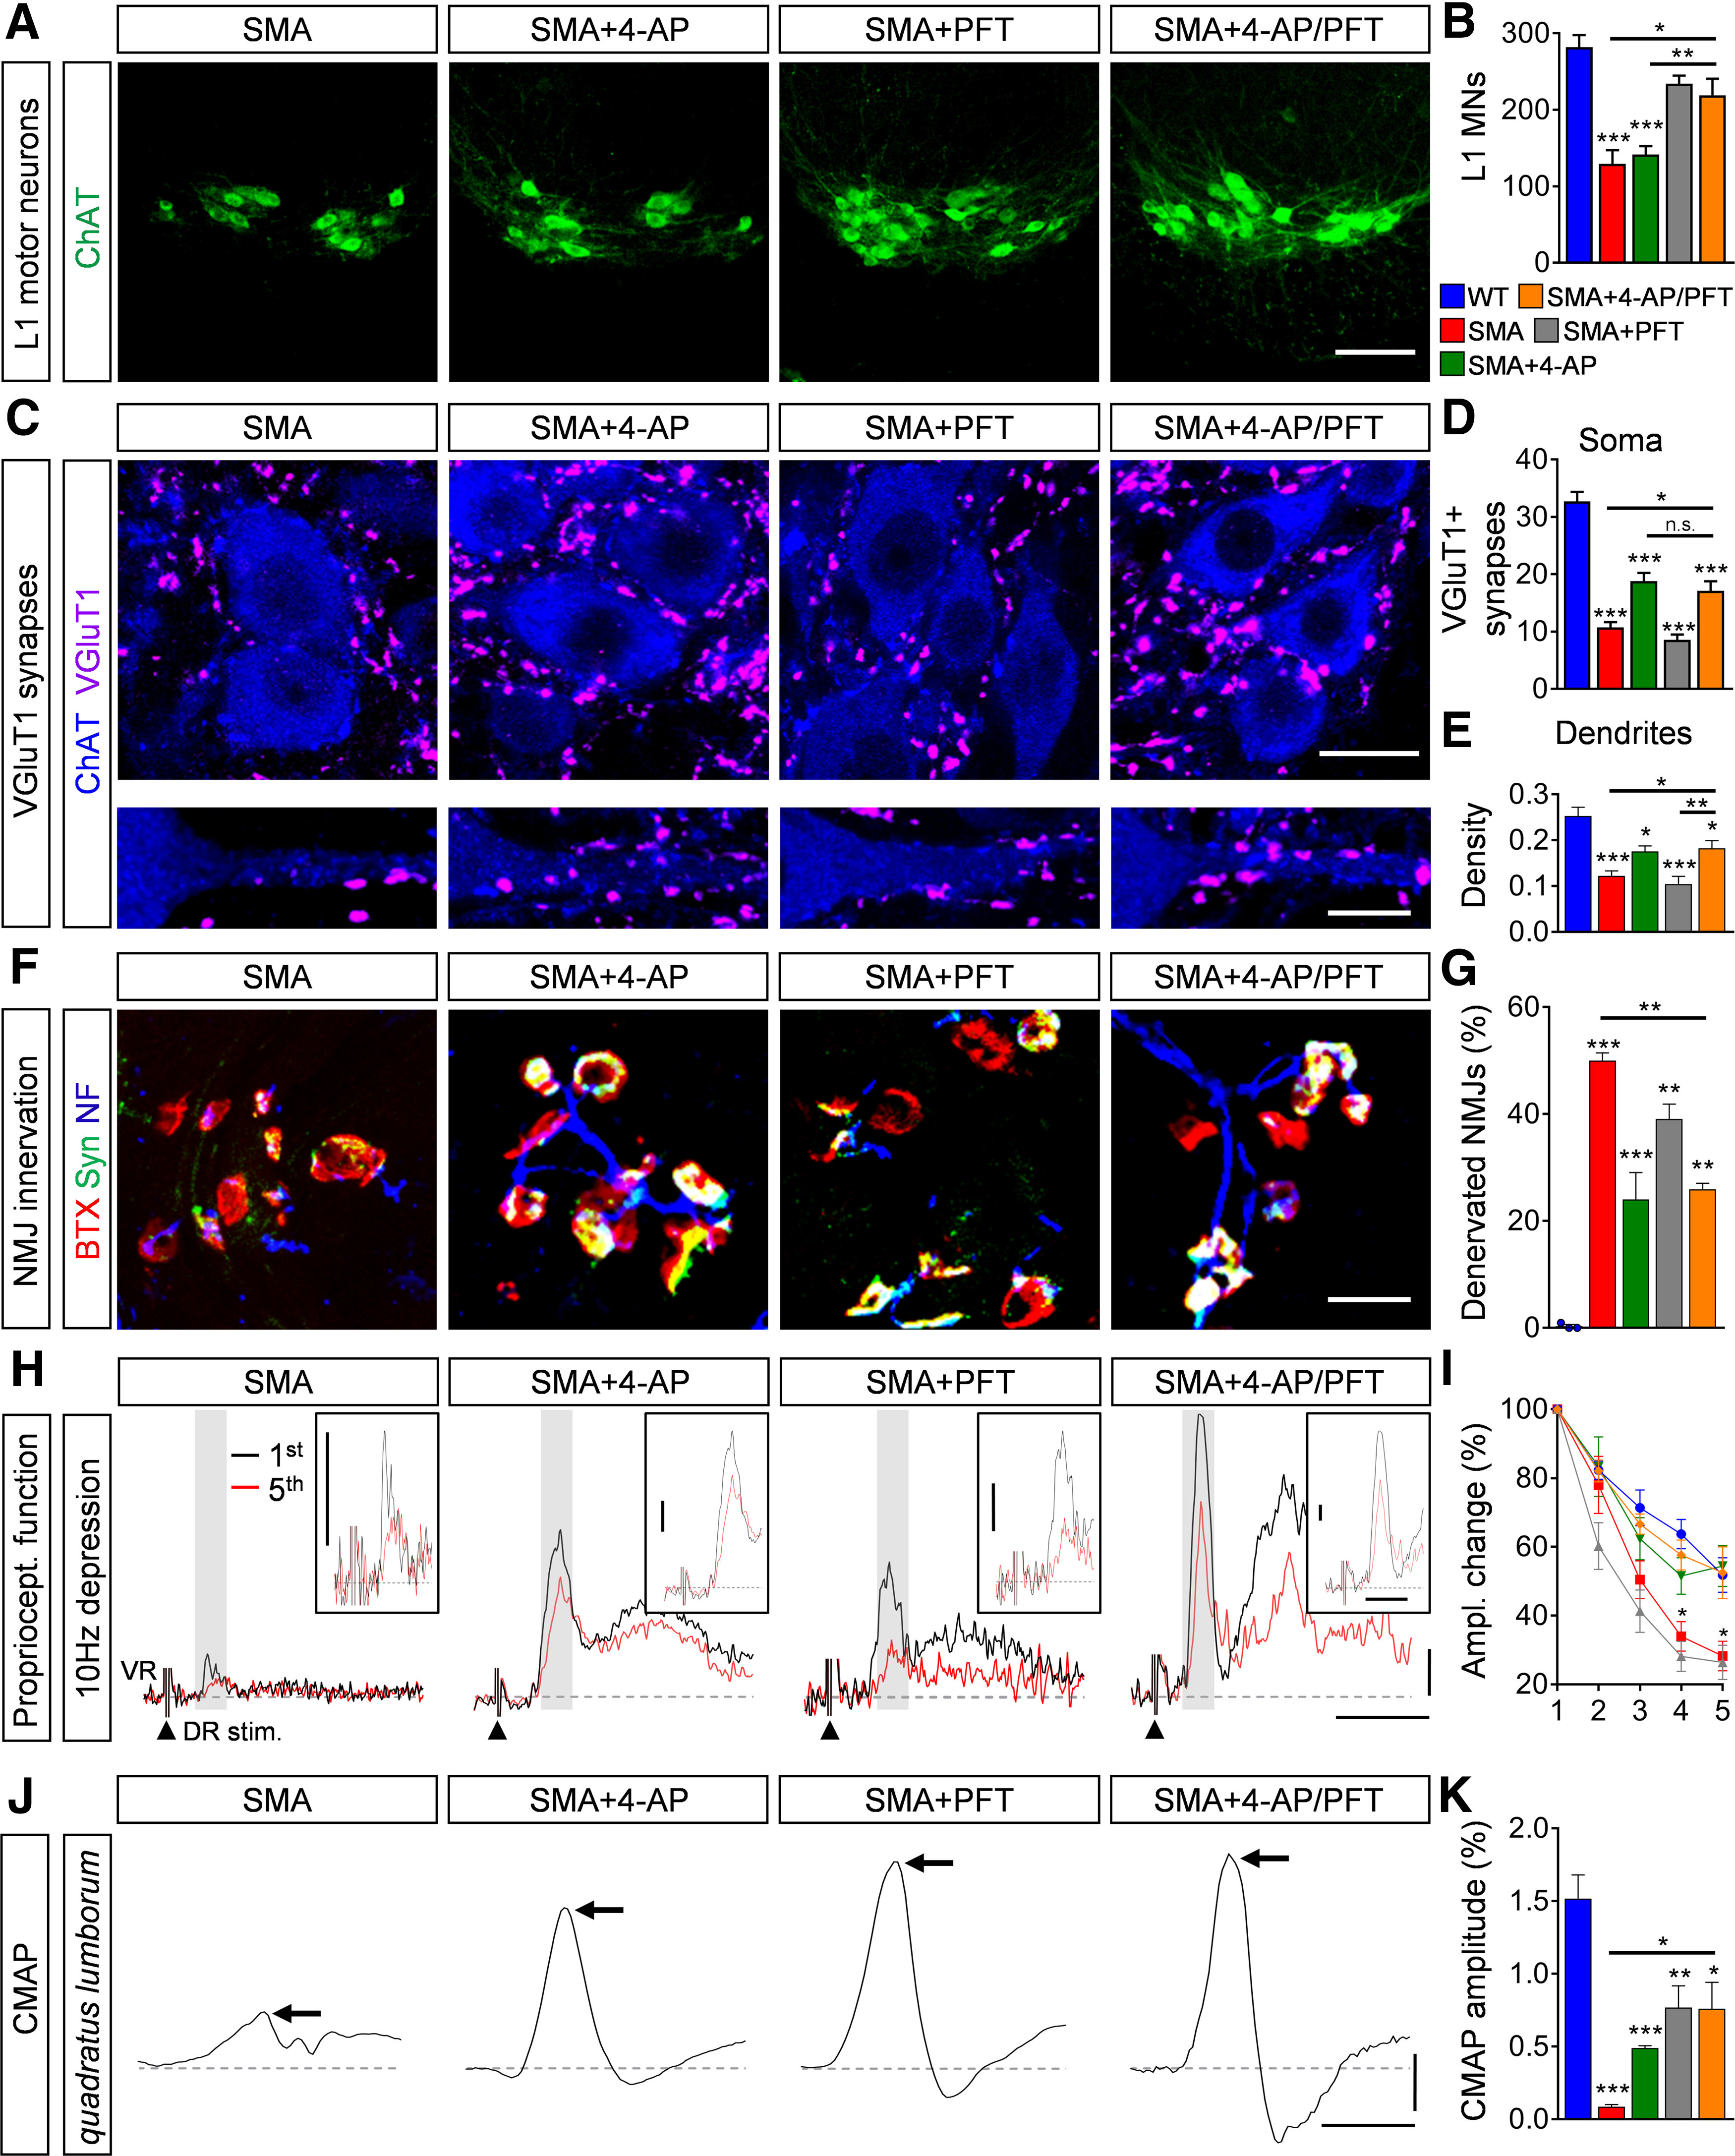
Figure 6.

Pharmacological p53 inhibition and 4-AP treatment show complementary effects on the sensory-motor circuit in SMA. A, Immunostaining of ChAT+ motor neurons (green) in L1 spinal cord sections from SMA, SMA + 4-AP, SMA + PFT and SMA + 4-AP/PFT mice at P11. Scale bar: 100 µm. B, Quantification of L1 motor neuron counts from WT, SMA, SMA + 4-AP, SMA + PFT, and SMA + 4-AP/PFT mice at P11. WT (5) = 282.2 ± 15.6, SMA (4) = 129.5 ± 17.81, SMA + 4-AP (6) = 141.7 ± 10.78, SMA + PFT (5) = 234 ± 10.71, SMA + 4-AP/PFT (4) = 219 ± 21.6, p for WT versus SMA and SMA + 4-AP < 0.0001, p for SMA versus SMA + PFT = 0.0010, p for SMA versus SMA + 4-AP/PFT = 0.0076, p for SMA + PFT versus SMA + 4-AP = 0.0013, p for SMA + 4-AP versus SMA + 4-AP/PFT = 0.0119, one-way ANOVA with Tukey's correction. Number of mice is reported in parentheses. C, Immunostaining of VGluT1+ synapses (magenta) and ChAT+ motor neuron (blue) somata (upper panel) and proximal dendrites (lower panel) in L1 spinal cord sections of the same groups as in A at P11. Scale bar: 20 µm (upper panel) and 10 µm (lower panel). D, E, Number of VGluT1+ synapses on the somata (D) and proximal dendrites (E) of L1 motor neurons from the same groups as B at P11. Soma: WT (14) = 32.71 ± 1.66, SMA (14) = 10.71 ± 0.96, SMA + 4-AP (15) = 18.8 ± 1.45, SMA + PFT (18) = 8.55 ± 0.95, SMA + 4-AP/PFT (13) = 17.08 ± 1.72, p for WT versus all other groups <0.0001, p for SMA versus SMA + 4-AP = 0.0007, p for SMA versus SMA + 4-AP/PFT = 0.0176, p for SMA + PFT versus SMA + 4-AP < 0.0001, p for SMA + PFT versus SMA + 4-AP/PFT = 0.0002, one-way ANOVA with Tukey's correction; dendrites: WT (12) = 0.253 ± 0.019, SMA (16) = 0.1229 ± 0.010, SMA + 4-AP (10) = 0.1758 ± 0.012, SMA + PFT (13) = 0.1047 ± 0.0167, SMA + 4-AP/PFT = 0.1828 ± 0.0166, p for WT versus SMA and SMA + PFT < 0.0001, p for WT versus SMA + 4-AP = 0.0127, p for WT versus SMA + 4-AP/PFT = 0.0195, p for SMA versus SMA + 4-AP/PFT = 0.0400, p for SMA + PFT versus SMA + 4-AP = 0.0221, p for SMA + PFT versus SMA + 4-AP/PFT = 0.0056, one-way ANOVA with Tukey's correction. Number of motor neurons from three mice is reported in parentheses. F, NMJ staining with bungarotoxin (BTX; red), synaptophysin (Syn; green), and neurofilament (NF; blue) of QL muscles from the same groups as in A at P11. Scale bar: 20 µm. G, Proportion of denervated NMJs in percent in the QL muscle of the same groups as in B at P11. WT (3) = 0.32 ± 0.32, SMA (4) = 49.96 ± 1.47, SMA + 4-AP (6) = 24.03 ± 5.02, SMA + PFT (4) = 39.07 ± 2.79, SMA + 4-AP/PFT (3) = 25.89 ± 1.17, p for WT versus SMA and SMA + PFT < 0.0001, p for WT versus SMA + 4-AP = 0.0043, p for WT versus SMA + 4-AP/PFT = 0.0075, p for SMA versus SMA + 4-AP = 0.0008, p for SMA versus SMA + 4AP/PFT = 0.0071, versus one-way ANOVA with Tukey's correction. Number of mice is reported in parentheses, >200 NMJs were analyzed per animal. H, Representative traces of the first (black) and fifth (red) VR responses recorded at P11 following stimulation of the homonymous L1 DR at 10 Hz from the same groups as in A. Scale bars: 0.2 mV and 10 ms. Inset scale bars: 0.1 mV, 5 ms. I, Quantification of amplitude changes in percent of the monosynaptic ventral root response following 10-Hz stimulation from the same groups as in B. Number of mice for WT = 5, SMA = 5, SMA + 4-AP = 5, SMA + PFT = 5, SMA + 4-AP/PFT = 5, p for SMA versus SMA + 4-AP/PFT at stimulus 4 = 0.0237 and 5 = 0.0487, multiple t test with Holm–Sidak method. J, CMAP recordings from the QL muscle following L1 ventral root stimulation from the same groups as in A at P11. Arrows indicate maximum amplitude. Scale bars: 0.2 mV, 3 ms. K, Quantification of CMAP amplitudes in millivolts recorded from the QL muscle in the same groups as in B at P11. CMAP in millivolts: WT (6) = 1.52 ± 0.16, SMA (6) = 0.08 ± 0.02, SMA + 4-AP (6) = 0.45 ± 0.02, SMA + PFT (9) = 0.76 ± 0.15, SMA + 4-AP/PFT (3) = 0.76 ± 0.18, p for WT versus SMA and SMA + 4-AP < 0.0001, p for WT versus SMA + PFT = 0.0016, p for WT versus SMA + 4-AP/PFT = 0.0225, p for SMA versus SMA + PFT = 0.0043, p for SMA versus SMA + 4-AP/PFT = 0.0499, one-way ANOVA with Tukey's correction. Number of mice is reported in parentheses. Data are presented as mean ± SEM. Asterisks on top of bars without a horizontal line indicate the significance compared with the WT group; n.s. = not significant; *p < 0.05, **p < 0.01, ***p < 0.001.
