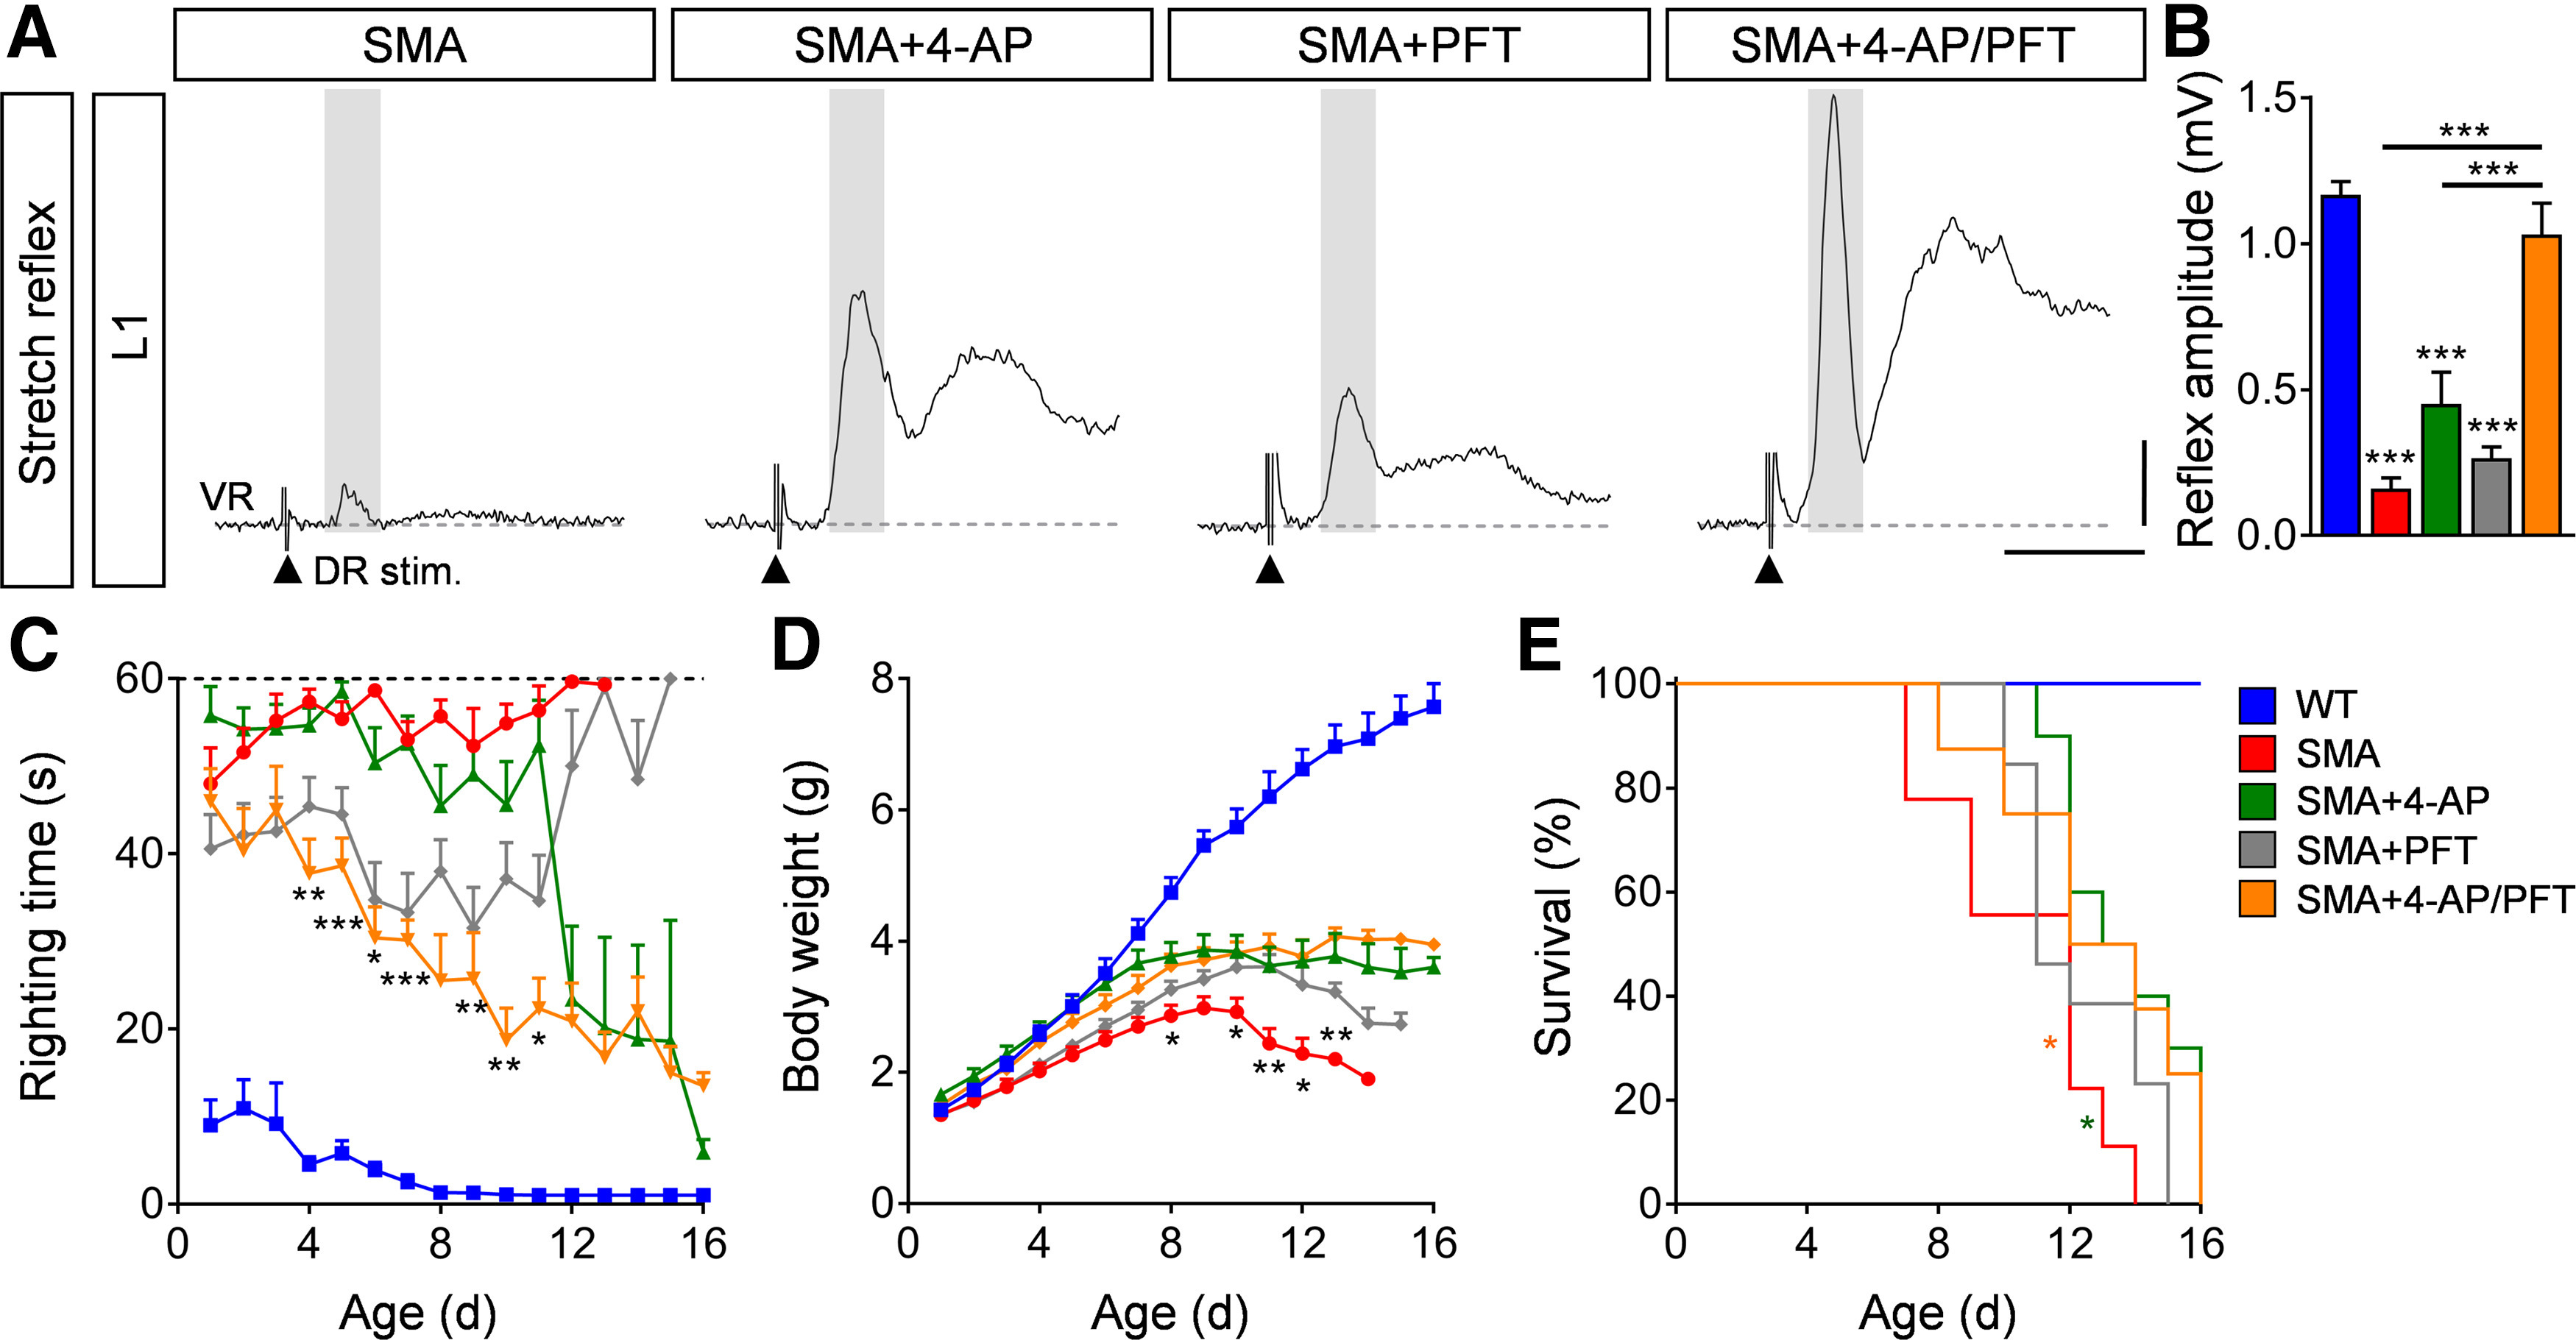
Figure 7.

Combinatorial inhibition of motor neuron death and 4-AP treatment fully restores the sensory-motor circuit in SMA. A, Representative traces of extracellular recordings from L1 ventral root (VR) following L1 dorsal root (DR) stimulation from SMA, SMA + 4-AP, SMA + PFT, and SMA + 4-AP/PFT mice. Shaded area marks the monosynaptic response. Arrowheads indicate the stimulus artifact. Scale bars: 0.2 mV, 10 ms. B, Quantification of spinal ventral root amplitudes in millivolts recorded from WT, SMA, SMA + 4-AP, SMA + PFT, and SMA + 4-AP/PFT mice at P11. Amplitudes in millivolts: WT (6) = 1.17 ± 0.05, SMA (7) = 0.16 ± 0.04, SMA + 4-AP (7) = 0.45 ± 0.10, SMA + PFT (9) = 0.26 ± 0.04, SMA + 4-AP/PFT (5) = 1.03 ± 0.11; p for WT versus SMA, p for SMA + 4-AP and SMA + PFT < 0.0001, p for SMA versus SMA + 4-AP = 0.0426, p for SMA + 4-AP/PFT versus SMA, p for SMA + 4-AP and SMA + PFT < 0.0001, one-way ANOVA with Tukey's correction. Number of mice is reported in parentheses. C–E, Righting time (C), body weight (D), and Kaplan–Meyer analysis of survival (E) from the same groups as in B. Number of mice for SMA + PFT = 18, SMA + 4AP/PFT = 14, for other groups please see legend of Figure 1K–M. Righting time: SMA + PFT n = 18 (P10), 16 (P11), 5 (P12), 4 (P13), 3 (P13), 1 (P15); SMA + 4-AP/PFT n = 14 (P7), 13 (P8), 12 (P10), 6 (P11), 4 (P13), 3 (P15), 2 (P16); p for SMA + 4-AP versus SMA + 4-AP/PFT indicated with asterisks at P4 = 0.0038, P5 < 0.0001, P6 = 0.0121, P7 < 0.0001, P9 = 0.0072, P10 = 0.0058, P11 = 0.0144; Body weight: p for SMA versus SMA + 4-AP/PFT indicated with asterisks at P8 = 0.0494, P10 = 0.0814, P11 = 0.0065, P12 = 0.0143, and P13 = 0.0097, multiple t test with Holm–Sidak method; Kaplan–Meyer analysis: p for SMA versus SMA + 4-AP indicated with asterisks = 0.014, p for SMA versus SMA + 4-AP/PFT = 0.044, Mantel–Cox test. Data are presented as mean ± SEM. Asterisks on top of bars without a horizontal line indicate the significance compared with the WT group; *p < 0.05, **p < 0.01, ***p < 0.001.
