Figure 2.
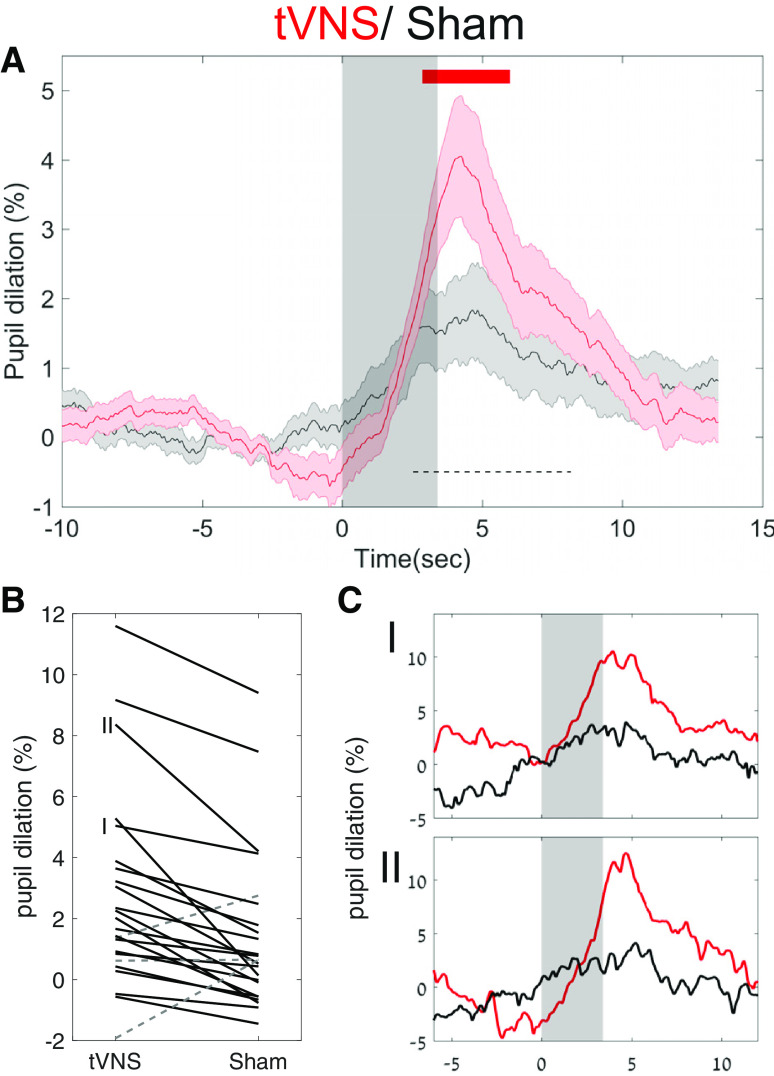
tVNS leads to greater pupil dilation than sham stimulation. A, Grand average pupil dilation in response to tVNS (red trace) and sham stimulation (black trace). Shaded areas around the trace indicate the SEM. The gray transparent rectangle indicates that the active current is on. The top red line indicates FDR-corrected statistical significance using the Wilcoxon signed-rank test. The dashed black bar indicates the time interval used to compute individual subject dilation values in B. B, Single-participant values in both tVNS and sham conditions between the two points of half-maximum (FDHM, 3.2–10.4 s; dashed black bar in A). The solid black lines denote tVNS > sham stimulation, while the dashed gray lines denote sham stimulation > tVNS. C, I, II, Single-participant traces. C, Two representative single-subject pupil time courses as indicated in B, with identical graphic representation as in A.

