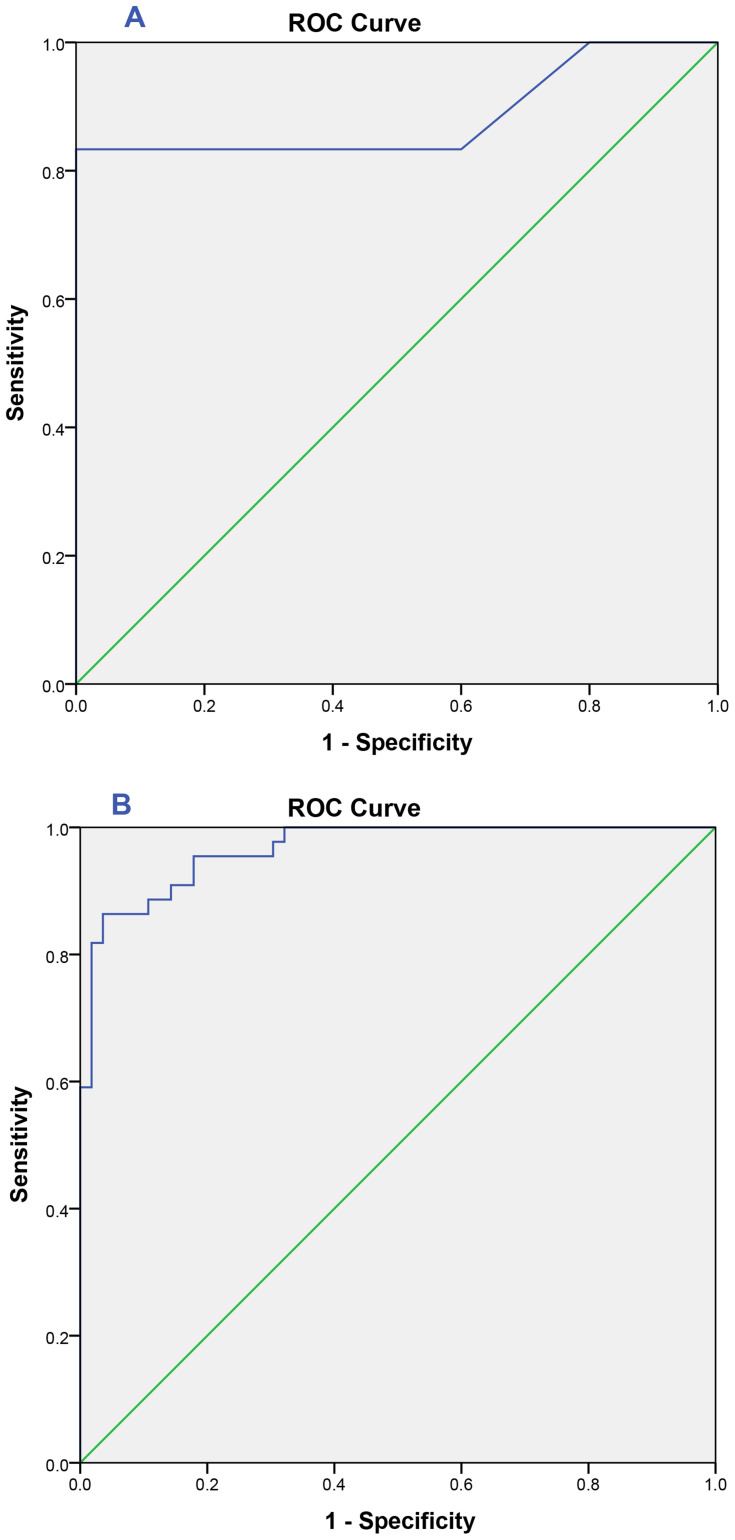
Figure 3.
ROC curve of mtDNA/gDNA ratio: (A) Healthy control group undergoing IVF: area under the curve (AUC)= 0.89 [0.76–1.0], cutoff value= 386.29 with sensitivity=83% and specificity= 100%. (B) PCOS group undergoing IVF: area under the curve (AUC)= 0.97 [0.94–0.99], cutoff value= 68.59 with sensitivity= 86%and specificity= 96%.

