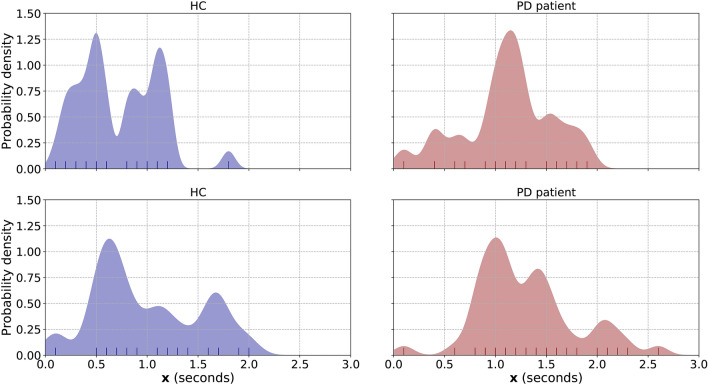
Figure 3.
Figure depicting the subject level representations for two HC (left column, blue) and two PD patients (right column, red). The vertical lines at the bottom of each figure denote the elements of (all PtM durations from every meal of the participant) that where used to estimate the PDF in each case. Finally, the calculated bandwidths for the HC are 0.064 (top) and 0.120 (bottom), while for the PD patients are 0.092 (top) and 0.095 (bottom).

