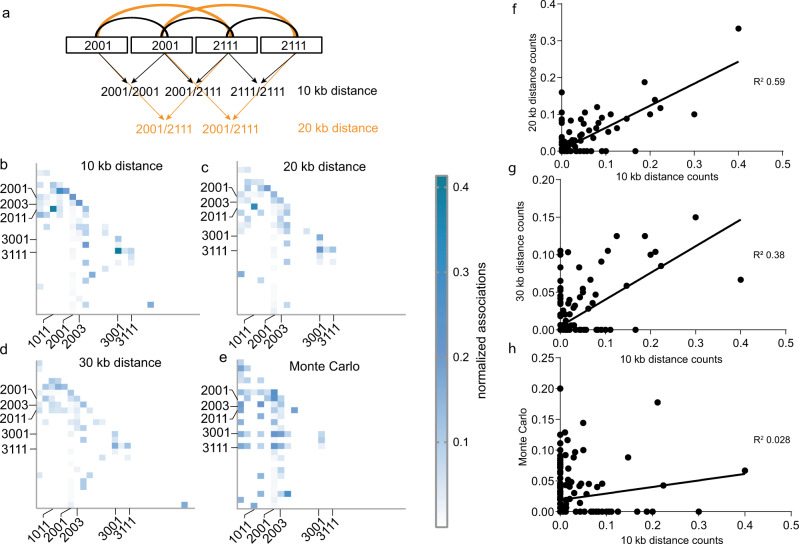
Fig. 2. NOR2 is organized in distinct rDNA clusters.
a Graphical description of the NeighbourFinder program. It counts the occurrence of rDNA unit types at a 10 kb (immediate neighbor), 20 kb (one unit downstream), or 30 kb (neighbor two units downstream) distance. b–e Heat maps depicting the number of neighboring rDNA unit types at a 10, 20, or 30 kb distance normalized to the sum of the rDNA units bearing the given features. Dark blue colors depict the highest relative number (0.42) and white the lowest (0). rDNA variants are listed as follows for each heat map: on the y-axis from top to bottom and for the x-axis from the left to right: 1001, 1003, 1011, 1013, 1111, 2001, 2003, 2011, 2013, 2101, 2111, 2113, 3001, 3011, 3111, 4001, 4111, 5001, 1003D, 1011D, 1013D, 2001A, 2001C, 2001B, and 2003C, (A, B, C, and D depict large deletions, see Table 1 for glossary) Most abundant ones are indicated. f–h Scatter plots showing the correlation between the frequencies of associated rDNA units of the 10 kb distance with the 20 kb distance (R2 = 0.59) (f), 10 kb distance with 30 kb distance (R2 = 0.38) (g), and the 10 kb distance with the numbers obtained by the Monte Carlo simulation (R2 = 0.028) (h).

