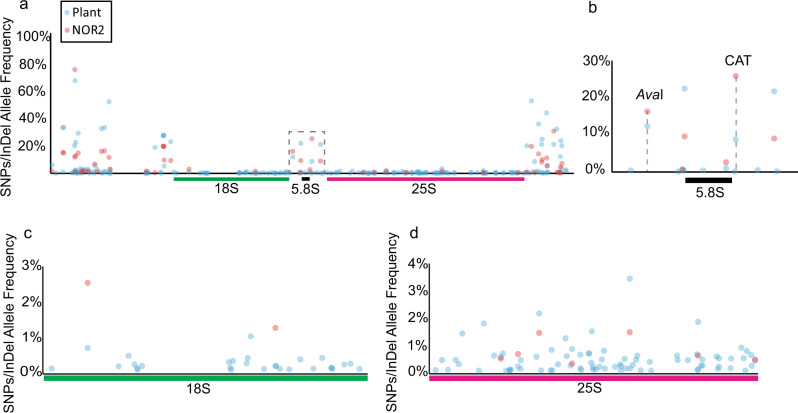
Fig. 3. rDNA variants are differentially distributed between NOR2 and NOR4.
a Plot depicting the SNP/InDel allele frequencies in rDNA units derived from genomic plant DNA sequencing (blue dots; representing allele frequencies in both NOR2 and NOR4) and from BAC sequencing (red dots; representing allele frequencies only in NOR2). Dashed box indicates the enlarged area depicted in b. b 5.8S rDNA region with the AvaI and the CAT alleles highlighted. c Allele frequencies in the 18S rDNA region. d Allele frequencies in the 25 S rDNA region.

