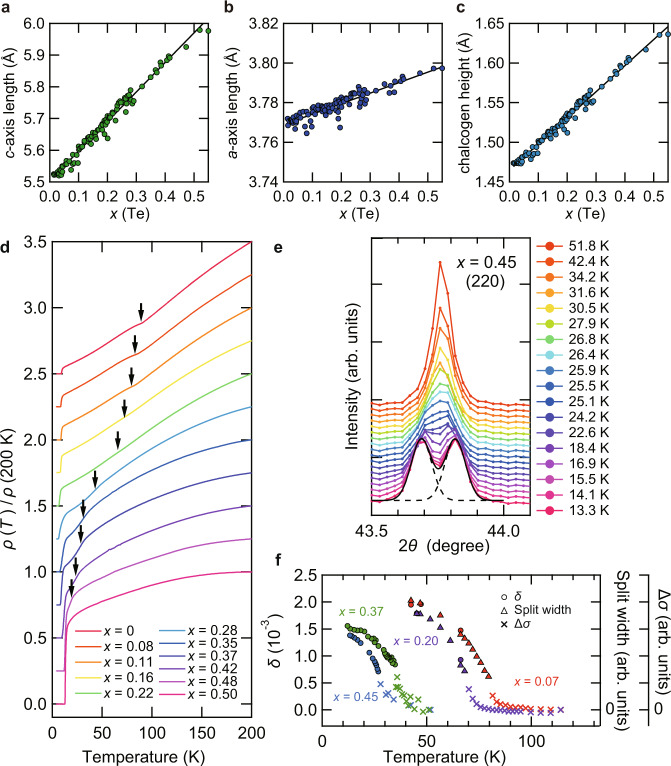
Fig. 1. Evolution of structural parameters and resistivity with Te composition in single crystals of FeSe1−xTex at ambient pressure.
a–c Lattice parameters and Te composition x(Te) determined by X-ray diffraction (XRD). Lattice constants c (a) and a (b) as well as the chalcogen height from the Fe plane (c) are shown as a function of x(Te). Solid line represents the linear x(Te) dependence (Vegard’s law). d Temperature dependence of the in-plane resistivity ρ normalized by the value at 200 K for 0 ≤ x(Te) ≲ 0.50. Each curve is shifted vertically for clarity. The resistive anomalies associated with the nematic transition temperature Ts (black arrows) are determined by the minimum (0 ≤ x(Te) ≲ 0.22) or the maximum (0.28 ≲ x(Te) ≲ 0.50) of the derivative curves dρ(T)/dT. e XRD intensity as a function of the scattering angle 2θ near the (220) Bragg peak measured at several temperatures for x ≈ 0.45. Each curve is shifted vertically for clarity. The black solid and dashed lines indicate the result of the two-peak fitting for the data at 13.3 K. f The orthorhombicity δ = (ao − bo)/(ao + bo) estimated from the two-peak fitting of (hk0) Bragg peaks for x(Te) ≈ 0.07, 0.20, 0.37, and 0.45 (circles, left axis) and the split width of (hkl) Bragg peaks for x(Te) ≈ 0.07 and 0.20 (triangles, right axis) as a function of temperature. We also plot additional width Δσ of single peak near the transition (crosses, right axis), estimated by the standard deviation σ of the single Gaussian fitting subtracted by the value at the maximum temperature measured for each sample.

