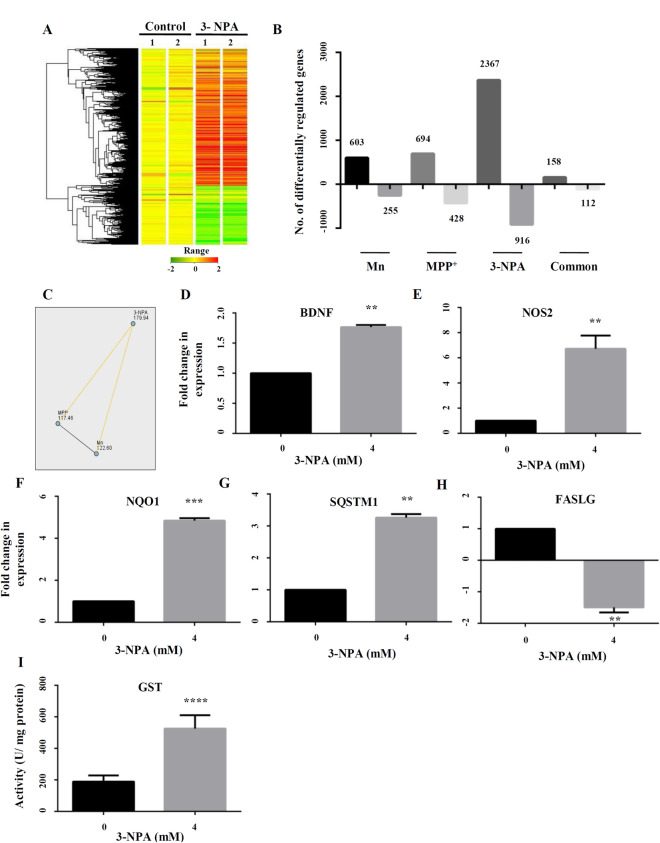
Figure 1.
Summary of the transcriptomics data along with functional classification and GO analysis of the differentially regulated genes upon 3-NPA/Mn/MPP+ treatment. Whole genome microarray of control and treated N27 cells (Mn/MPP+/3-NPA) following mRNA extraction and hybridization against rat genome array revealed several differentially regulated genes. The heat map of 3-NPA transcriptome vs. control is depicted (A) along with the colour coded range of gene expression. The heat map was generated using GeneSpring GX software (Agilent). (B) Number of genes differentially regulated in Mn/MPP+/3-NPA models along with common genes across the groups. Non-parametric analysis by Kruskal Wallis test followed by post-hoc pair wise comparison with Dunn–Bonferroni correction (C) of differentially regulated genes across the three models revealed that the dataset of 3-NPA was different and exclusive from that of Mn (p < 0.001) and MPP+ (p < 0.001). To validate the microarray data, 5 genes: BDNF (D), NOS2 (E), NQO1 (F), SQSTM1 (G) and FASLG (H) were tested, whose expression was consistent with the microarray data. Total GST activity was higher in 3-NPA treatment vs. control (I), consistent with the microarray data (n = 3 trials per experiment; **p < 0.01, ***p < 0.001, ****p < 0.0001).

