Figure 3.
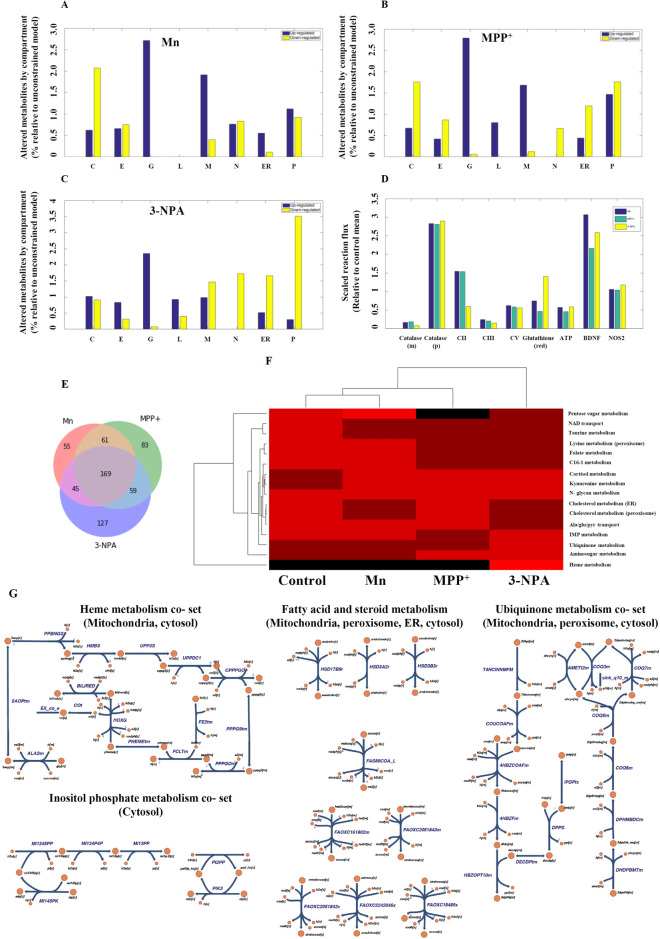
Organellar changes based on metabolic network interpretation of differentially expressed transcripts in toxic cell models vs. control. (A–C) Mn, MPP+, and 3-NPA organelle changes, respectively (C = cytosol; E = extracellular; G = golgi apparatus; L = lysosome; M = mitochondria; N = nucleus; ER = endoplasmic reticulum; P = peroxisome). (D) Flux changes for selected enzymes for context specific GeMMs. Mean reaction fluxes for different enzymes and metabolites relative to the corresponding mean flux for untreated N27 cells are shown. All pairwise comparisons are statistically significant for the paired t-test at p < 0.05 following Bonferroni correction except for: Mn vs. MPP+ NOS2, and Mn vs 3-NPA NOS2. (m = mitochondria, p = peroxisome, red = reduced state). (E) Venn diagram of the reactions based on the differentially expressed genes in each neurotoxic model vs. control (generated using Python (Matplotlib library); URL—https://matplotlib.org/). (F) Clustering of reaction co-sets for GeMMs for control, Mn, MPP+ and 3-NPA treated cells (generated using MATLAB version 2015b). The colour scale is linear from 0 (Black) to 1 (Bright red). (G) Pathway maps of the co-sets and reaction pathways that are differentially active in 3-NPA treated cells and observed to be involved in autophagy (generated using Escher; URL—https://escher.github.io). The heme co-set is responsible for the flux restrictions on CII. Detailed descriptions of the co-sets and constituent reactions are provided in the Supporting information spreadsheets.

