Figure 5.
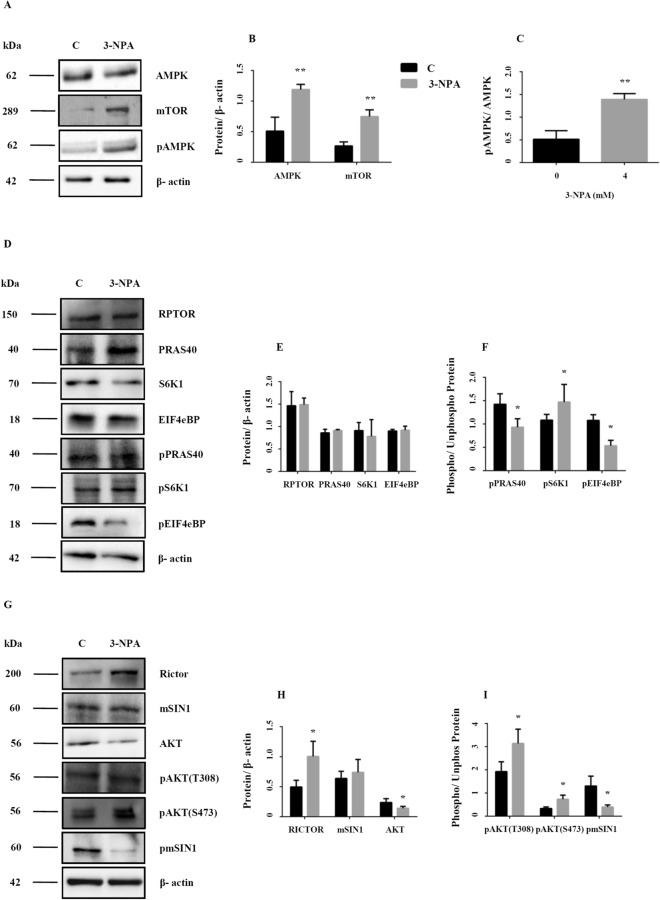
Mechanism and pathways activated in 3-NPA induced autophagy. Consistent with the microarray data, AMPK was up-regulated at the protein level (A,B, corresponding complete blot in supplementary Figure 11ii) and was activated upon 3-NPA treatment as indicated by increased phosphorylation (A,C, corresponding complete blot in supplementary Figure 11iii). mTOR itself can function in presence of or independent of AMPK, whose levels were moderately higher in 3-NPA treatment (A,B, corresponding complete blot in supplementary Figure 11iv) (n = 3 trials per experiment; *p < 0.05, **p < 0.01). Western blotting on total cell extracts revealed that the primary subunit of mTORC1, RAPTOR, was unchanged upon 3-NPA treatment (D,E, corresponding complete blot in supplementary Figure 12i) and so were the levels of the other regulatory subunit PRAS40 (D,E, corresponding complete blot in supplementary Figure 12ii) and its downstream targets including S6K1 (D,E, corresponding complete blot in supplementary Figure 12iii) and EIF4EBP (D,E, corresponding complete blot in supplementary Figure 12iv). However, the phosphorylation status of PRAS40 (pPRAS40-D,F, corresponding complete blot in supplementary Figure 13i) and EIF4EBP (pEIF4EBP-D,F, corresponding complete blot in supplementary Figure 13iv) was significantly lower in 3-NPA treatment along with increased phosphorylation of S6K1 (pS6K1-D,F, corresponding complete blot in supplementary Figure 13ii). (G–I) 3-NPA induced changes in mTORC2 subunits and its downstream targets. The primary subunit of mTORC2, RICTOR, was upregulated upon 3-NPA treatment (G,H, corresponding complete blot in supplementary Figure 14i) unlike the other regulatory subunit mSIN1 (G,H, corresponding complete blot in supplementary Figure 14ii) and its downstream target AKT (G,H, corresponding complete blot in supplementary Figure 14iii). However the phosphorylation status of mSIN1 (pSIN1-G,I, corresponding complete blot in supplementary Figure 15i) was much lower, while phosphorylation of AKT at S473 [pAKT (S473)-G,I, corresponding complete blot in supplementary Figure 15iii] and T308 (pAKT (T308)-G,I, corresponding complete blot in supplementary Figure 15ii) was significantly higher in 3-NPA treatment (n = 3 trials per experiment; *p < 0.05, **p < 0.01). The western data for all the proteins in this figure are from independent blots. All blots were cut to retain only the region depicting the protein of interest.

