Figure 6.
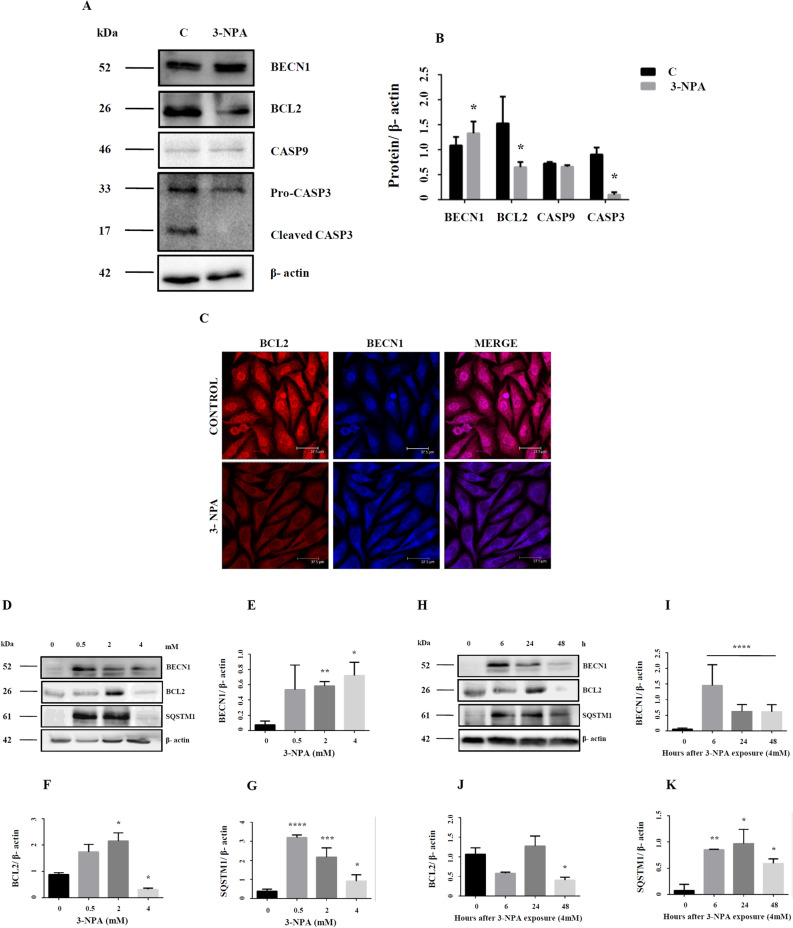
Dynamics between apoptosis and autophagy in 3-NPA treated N27 cells. BECN1, a key molecule in autophagy that balances autophagy and apoptosis was up-regulated (A,B, corresponding complete blot in supplementary Figure 16i) in 3-NPA treatment. Apoptotic markers BCL2 and CASP3 were down-regulated (A,B, corresponding complete blots in supplementary Figure 17i and vii) whereas CASP9 was slightly lowered but not statistically significant in 3-NPA treated cells (n = 3 trials per experiment; *p < 0.05). In case of CASP3, along with lowered pro-caspase levels in 3-NPA, the active form was also not generated. (C) Representative confocal images of control and 3-NPA treated cells stained with BCL2 and BECN1 vs. control (n = 3 coverslips per group). Dose (0–4 mM) (D–G, corresponding complete blots in supplementary Figure 16ii (BECN1), 17ii (BCL2) and iv (p62)) and time (0–48 h) (H–K, corresponding complete blots in supplementary Figures 16iv (BECN1), 17iii (BCL2) and vi (p62)) dependence of autophagic and apoptotic markers are shown in 3-NPA vs. control samples (n = 2 trials per experiment; *p < 0.05, **p < 0.01, ***p < 0.001, ****p < 0.0001). The western data for all the proteins in this figure are from independent blots. All blots were cut to retain only the region depicting the protein of interest.

