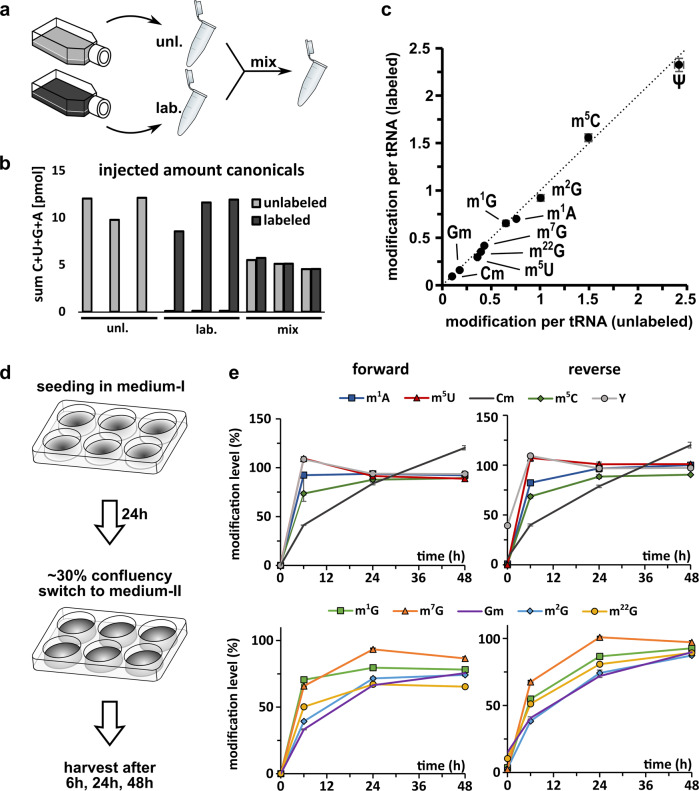
Fig. 3. Validation of cell culture NAIL-MS.
a Cells were grown in unlabeled or fully labeled media for 7 days. Upon harvesting one aliquot was mixed prior to processing (mix). Total tRNA was purified and all samples were analyzed by LC-MS/MS. b Summed amount of canonical nucleosides (C + U + G + A) detected by LC-MS/MS for unlabeled and labeled isotopologues. The bars show single replicates of three unlabeled, three labeled and three mixed aliquots. c Abundance of labeled modifications plotted against the abundance of unlabeled modifications in the mix samples. The dotted line indicates the location of the expected values as a visual guide. d Experimental setup of time course study to investigate temporal placement of RNA modifications. The experiment was done forward (start with unlabeled, change to labeled medium) and reverse (vice versa). e Results of time course study. Plotted on the y-axis is the abundance of modification in new transcripts normalized to the abundance before experiment initiation (T = 0). Note: In the reverse experiment, minor signals of unlabeled nucleosides are present at T = 0 and thus the starting value is sometimes larger than 0%. All experiments were done with purified total tRNA and are from n = 3 biol. replicates. Symbols reflect the mean and error bars reflect standard deviation.

