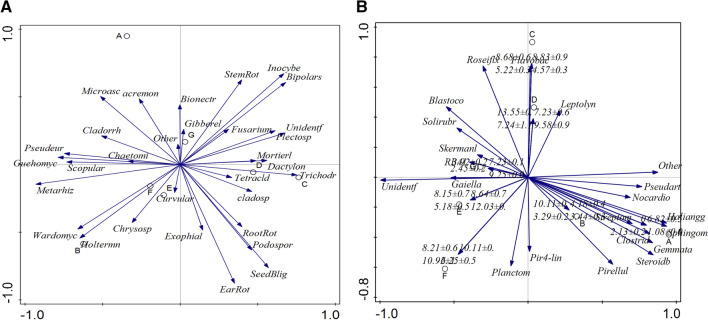
Figure 7.
(A) RDA analysis of the relationship between the disease incidence and relative abundance of fungal genus of different cropping years. Correlation between different disease incidence and RDA axes were represent by the length and angel of arrows. (B) RDA analysis of the relationship between the disease incidence of different continuous cropping year and relative abundance of bacteria genus of different cropping years. Correlation between different disease incidence and RDA axes were represent by the length and angel of arrows.

