
Fig. 7. Symptom-driven testing and contact tracing need to be combined to control the disease.
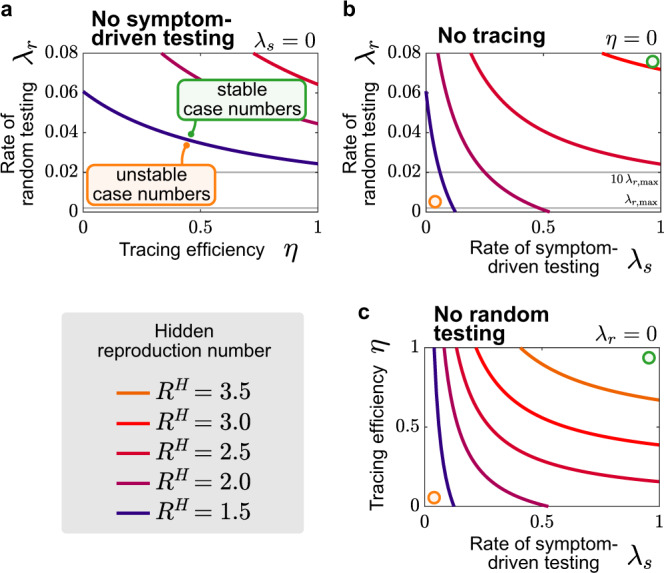
Stability diagrams showing the boundaries (continuous curves) between the stable (controlled) and uncontrolled regimes for different testing strategies combining random testing (rate λr), symptom-driven testing (rate λs), and tracing (efficiency η). Gray lines in plots with λr-axes indicate capacity limits (for our example Germany) on random testing () and when using pooling of ten samples, i.e., . Colored lines depict the transitions between the stable and the unstable regime for a given reproduction number (color-coded). The transition from ‘stable" to ‘unstable" case numbers is explicitly annotated for in panel a. a Combining tracing and random testing without symptom-driven testing is in all cases not sufficient to control outbreaks, as the necessary random tests exceed even the pooled testing capacity (). b Combining random and symptom-driven testing strategies without any contract tracing requires unrealistically high levels of random testing to control outbreaks with large reproduction numbers in the hidden pool (). The required random tests to significantly change the stability boundaries exceed the available capacity in Germany . Even considering the possibility of pooling tests () often does not suffice to control outbreaks. c Combining symptom-driven testing and tracing suffices to control outbreaks with realistic testing rates λs and tracing efficiencies η for moderate values of reproduction numbers in the hidden pool, , but fails to control the outbreak for large . The curves showing the critical reproduction number are obtained from the linear stability analysis (Supplementary Eq. (1)).