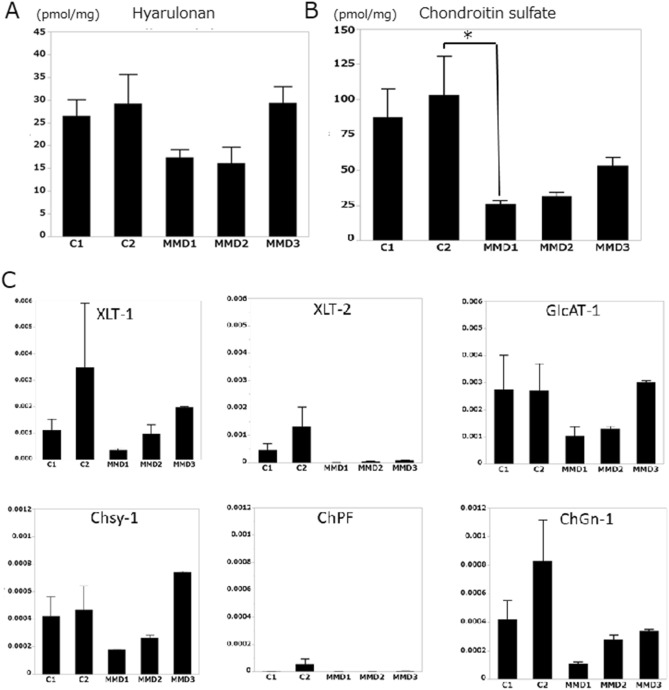
Figure 4.
(A) The amount of HA in each iPSEC sample. (B) The amount of CS produced by each iPSEC sample. MMD1 produced significantly smaller amounts of CS compared with Control 2 (*P < 0.05). (C) Expression of enzymes for CS synthesis. Although there was no statistical significance, XLT-2 tended to be downregulated in MMD. XLT, xylose transferase; GlcAT-I, glucuronosyltransferase-I; ChSy-1, chondroitin synthase-1; ChPF, chondroitin polymerizing factor; ChGn, chondroitin β1,4-N-acetylgalactosaminyltransferase. Error bars are SEM.

