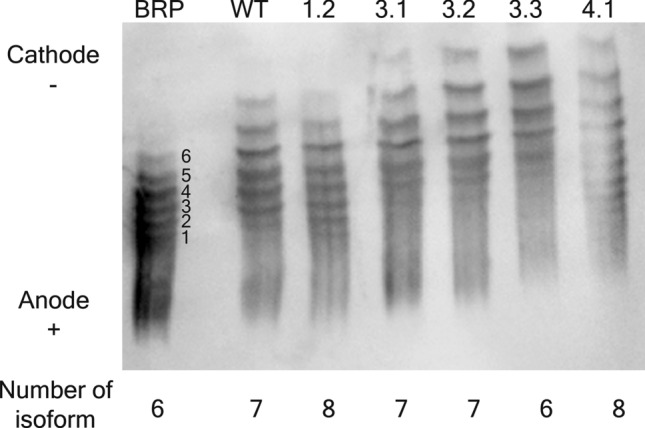
Figure 3.

Isoform analysis by IEF of EPO proteins. EPO standard, wild type and mutant proteins were separated according to their pI in IEF gel with a pH gradient of 2–6 followed by Western blot. The chemiluminescence signals of protein samples were detected and the image was taken using ImageQuant LAS 4000 control software version 1.2 provided with ImageQuant LAS 4000 machine (https://www.cytivalifesciences.com/en/us) at the exposure time of 5 s. The native blot with multiple exposures is presented in Supplementary Fig. S3. The separated bands of the proteins represent the number of their existing glycoforms. Distribution of different isoforms of the purified EPO protein was compared to BRP, an EPO standard. BRP, EPO standard; WT, EPO-WT; 1.2, EPO-1.2 (L70V, V74L, L102I); 3.1, EPO-3.1 (T106A); 3.2, EPO-3.2 (T106G); 3.3, EPO-3.3 (T106H); 4.1, EPO-4.1 (L109A).
