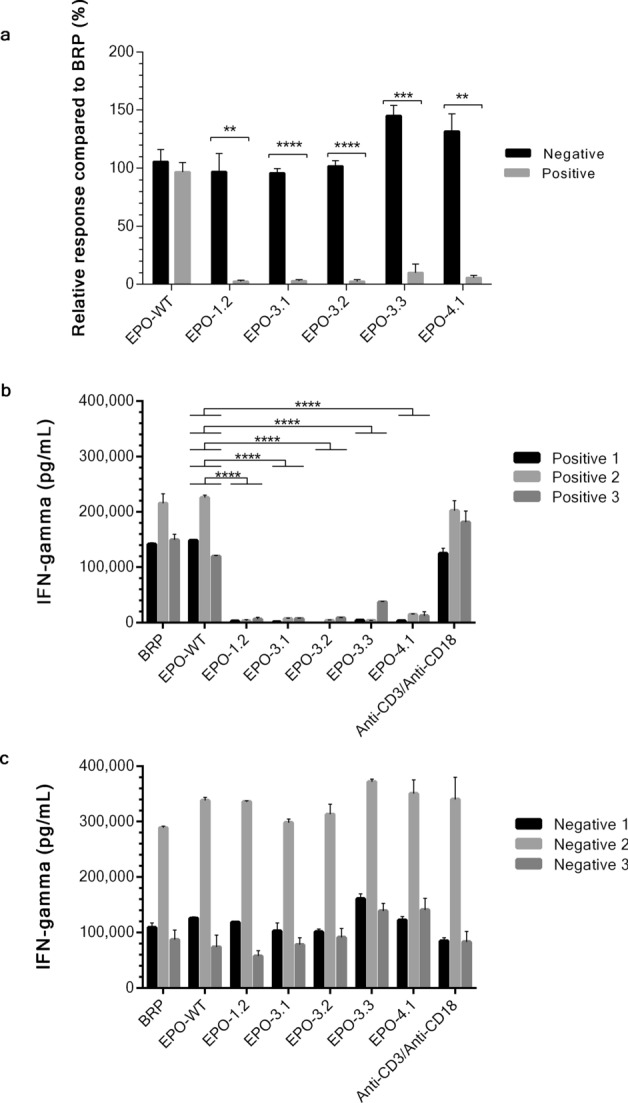
Figure 5.

Ex vivo immunogenicity test of EPO proteins. Mature DC cells were pulsed with EPO protein including EPO-1.2 (L70V, V74L, L102I), EPO-3.1 (T106A), EPO-3.2 (T106G), EPO-3.3 (T106H) or EPO-4.1 (L109A). Anti-CD3/anti-CD28, the known CD4+ T cell activator was used as a positive control. EPO-pulsed DCs and CD4+ T cell from the same individual were cocultured at a 1:20 ratio. CD4+ T cell activation was quantified by the measurement of IFN-γ release using sandwich ELISA. The mean value from 3 HLA-DRB1*09-negative volunteers and 3 HLA-DRB1*09-positive volunteers were combined as a negative group or a positive group, respectively. Each group was relatively compared to the response to BRP and presented in the percentage of relative response of EPO proteins shown in (a). Bar graphs are shown as mean ± SEM calculated from 3 individuals in each group. Asterisks denote a significant difference by t-test (* p ≤ 0.05, ** p ≤ 0.01, *** p ≤ 0.001, **** p ≤ 0.0001). IFN-γ level of each HLA-DRB1*09-positive volunteers shown in (b) and HLA-DRB1*09-negative volunteers shown in (c). Bar graphs are shown as mean ± SEM calculated from duplicate experiments. The similarity or difference (**** p ≤ 0.0001) in IFN-gamma level among BPR, EPO-WT, EPO mutants and anti-CD3/anti-CD28 in both positive and negative group was analyzed by one-way ANOVA followed by Tukey’s multiple comparisons test for (b) and (c). The significant differences were only shown in comparison to EPO-WT in this figure. Graphs were generated using GraphPad Prism version 8.4.3 for Windows (https://www.graphpad.com/).
