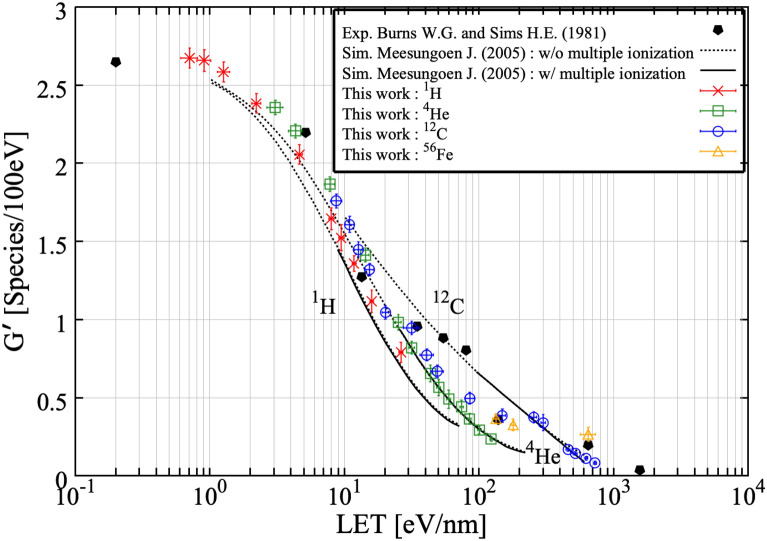
Figure 7.
LET dependent G-values of ·OH at 1 μs after irradiation of a water target with different radiation types. The solid lines presented by Meesungunoen J. and Jay-Gerin J.P. represent the results of Monte Carlo simulations incorporating multi-ionization of water. The short-dot lines presented by by Meesungunoen J. and Jay-Gerin J.P. correspond to simulated G-values calculated as a function of LET without including the mechanism of multi-ionization of water47. Experimental data presented by Burns W.G. and Sims H.E.50 were used for comparison with simulated LET dependence of G-values.

