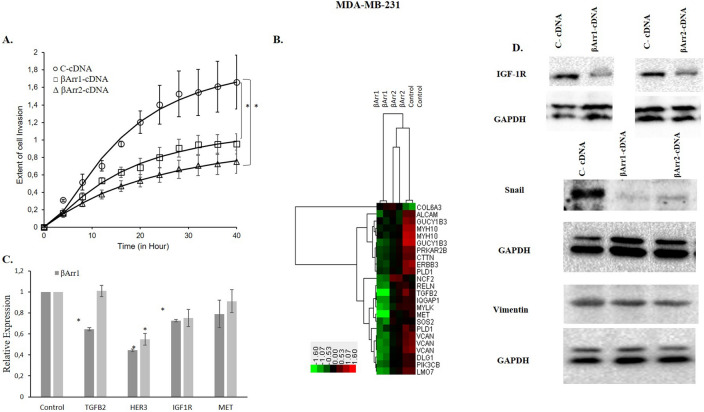
Figure 8.
Overexpression of βArr1 or βArr2 and decreased cell invasion in MDA-MB-231. Invasion was significantly reduced in βArr1- or βArr2-cDNA transfected MDA-MB-231 cells. (A) Invasion of C (control-cDNA)-, βArr1- or βArr2-cDNA transfected MDA-MB-231 was monitored continuously using an xCelligence Real-Time Cell Analyzer in Matrigel coated CIM-plates. The cells were seeded in the upper chamber of the plates and impedance measurements of cell invasion were recorded at 40 h. Y axis shows changes in impedance as a measurement of the extent of cell invasion. Data are presented as mean ± standard error of the mean; n = 4–5; * = p < 0.05 versus C-cDNA. (B) Two-way hierarchical clustering analysis was performed for the clustering of samples according to both genes (right panel) and sample types (top panel). The heatmap was visualized by Treeview. Hierarchical clustering performed with the motility and invasion related genes obtained from the microarray analysis successfully separated βArr1 and βArr2 overexpressed cells from control cells. Green boxes represent downregulation, red boxes are used for upregulation and black means no change in the gene expression levels and the expression levels vary between − 1.6 and 1.6 folds in log2 scale. (C) The expression profiles of selected motility and invasion related genes were determined by qRT-PCR experiments and expression of TGFβ2, HER3, IGF1R was significantly down regulated. Data are presented as mean ± standard error of the mean (*p < 0.05 versus C-cDNA). (D) The protein expression levels of mesenchymal markers Snail, Vimentin and IGF-1R were detected by Western blot analysis. IGF-1R and Snail were downregulated in βArr1- or βArr2 overexpressed MDA-MB-231 cells while Vimentin expression stayed stable.

