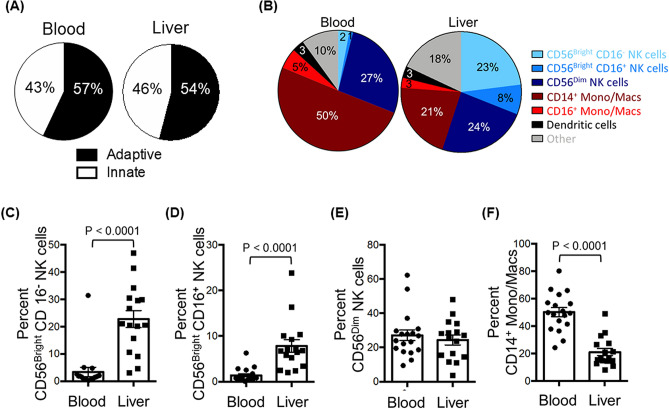
Figure 2.
Comparison of the abundance of innate immune cells in the liver and in peripheral blood. (A) Pie charts depicting the composition of innate and adaptive immune cells from peripheral blood (left) and liver (right). (B) Pie charts depicting the composition of CD45+ lineage negative (CD3-, CD19-, CD20-) innate immune populations of the peripheral blood (left) and liver (right). (C) The percentage of CD56Bright CD16- NK cells of total hematopoietic (CD45+), lineage negative (CD3-, CD19-, CD20-) cells from liver and peripheral blood mononuclear cells. (D) The percentage of CD56Bright CD16+ NK cells. (E) The percentage of CD56Dim CD16+ NK cells. (F) The percentage of CD14+ monocytes/macrophages. Horizontal bars depict the mean ± SEM. N = 16 liver leukocytes, n = 18 PBMCs by unpaired t test.

