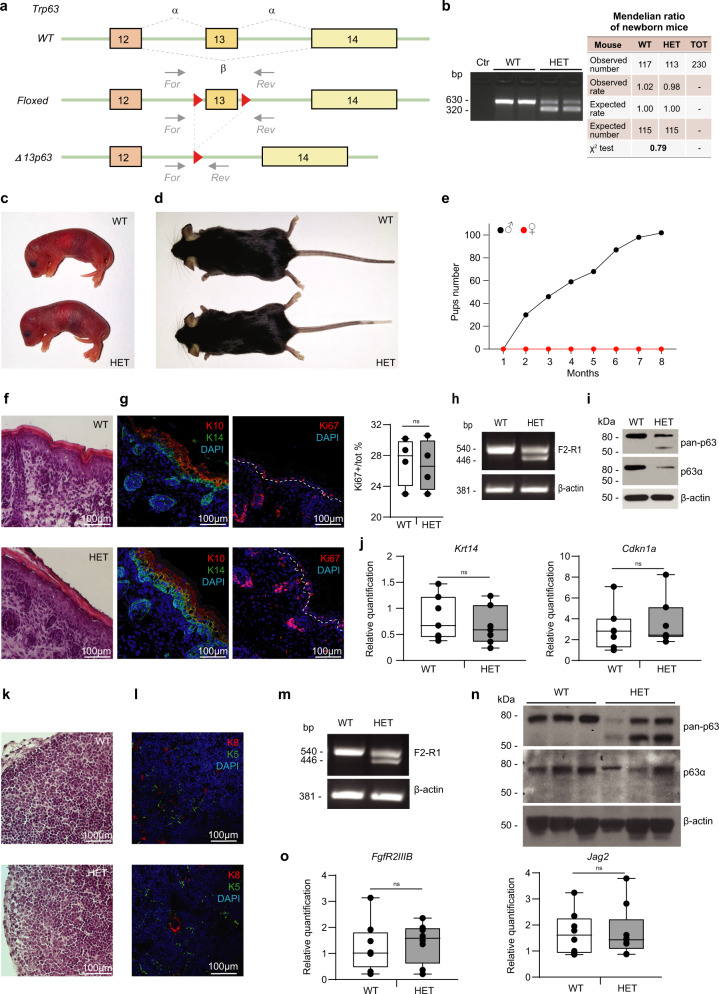
Fig. 1. Generation and characterization of Δ13p63 heterozygous mice.
a Strategy for the generation of Δ13p63 heterozygous mice (HET Δ13p63, indicated as HET in figure). The targeting vector was generated by inserting loxP sites (red triangles) into the genomic regions flanking exon 13 to obtain a floxed allele. Heterozygous floxed mice were crossed with CMV-Cre transgenic mice to obtain HET mice. The primers used for genotyping the WT and HET mice are shown (For, forward; Rev, reverse); b Agarose gel electrophoresis of the PCR products obtained using genomic DNA from WT and HET mice as a template. Ctr indicates a no-template PCR. Table on the right side shows Mendelian distribution of genotypes in newborn mice (WT and HET). p > 0.05 by X2 test; c Newborn WT and HET male mice; d Three-month-old WT and HET male mice; e Pups number obtained by crossing HET males (black line, n = 4) and HET females (red line, n = 10) with WT mice for a period of 8 months; f Hematoxylin and eosin staining of P1 backskin sections of WT and HET mice; g IF staining of K10/K14 and Ki67 marker on P1 backskin sections of WT and HET. Ki67 positive nuclei counting was performed on P1 backskin sections of WT (n = 6) and HET (n = 6) mice. Epidermis Ki67 positive nuclei percentage was shown in the graph on the right side. The centre of the boxplots represents median, boxes represent first (25%) and third (75%) quartiles, whiskers extend to the most extreme datapoints that are no more than 1.5-fold of the interquartile range from the box. Single values are plotted as individual points. p-value > 0.05 by two-tailed unpaired Student’s t-test; h Semi-quantitative PCR analysis of p63 isoforms expression in P1 epidermises of WT and HET mice; i WB analysis of p63 isoforms expression in WT and HET mice protein extracts of cultured primary keratinocytes. β-actin was used as loading control. j Boxplots showing Krt14 and Cdkn1a (p21) expression quantification by RT-qPCR in epidermises of WT (n = 7) and HET (n = 7) mice. p-value > 0.05 by two-tailed unpaired Student’s t-test; k Haematoxylin and eosin staining of P1 thymus sections of WT and HET mice; l IF staining of K5/K8 markers on thymus sections of WT and HET mice; m Semi-quantitative PCR analysis of p63 isoforms expression in P1 thymus of WT and HET mice; n WB analysis of p63 isoforms expression in protein extracts of WT and HET mice P1 thymuses. β-actin was used as loading control. o Boxplots showing FgfR2IIIb and Jag2 expression quantification by RT-qPCR in thymuses of WT (n = 7) and HET (n = 7) mice. p-value > 0.05 by two-tailed unpaired Student’s t-test. The images shown are representative of all the experiments performed (at least n = 6) Source data are provided as a Source Data file.

