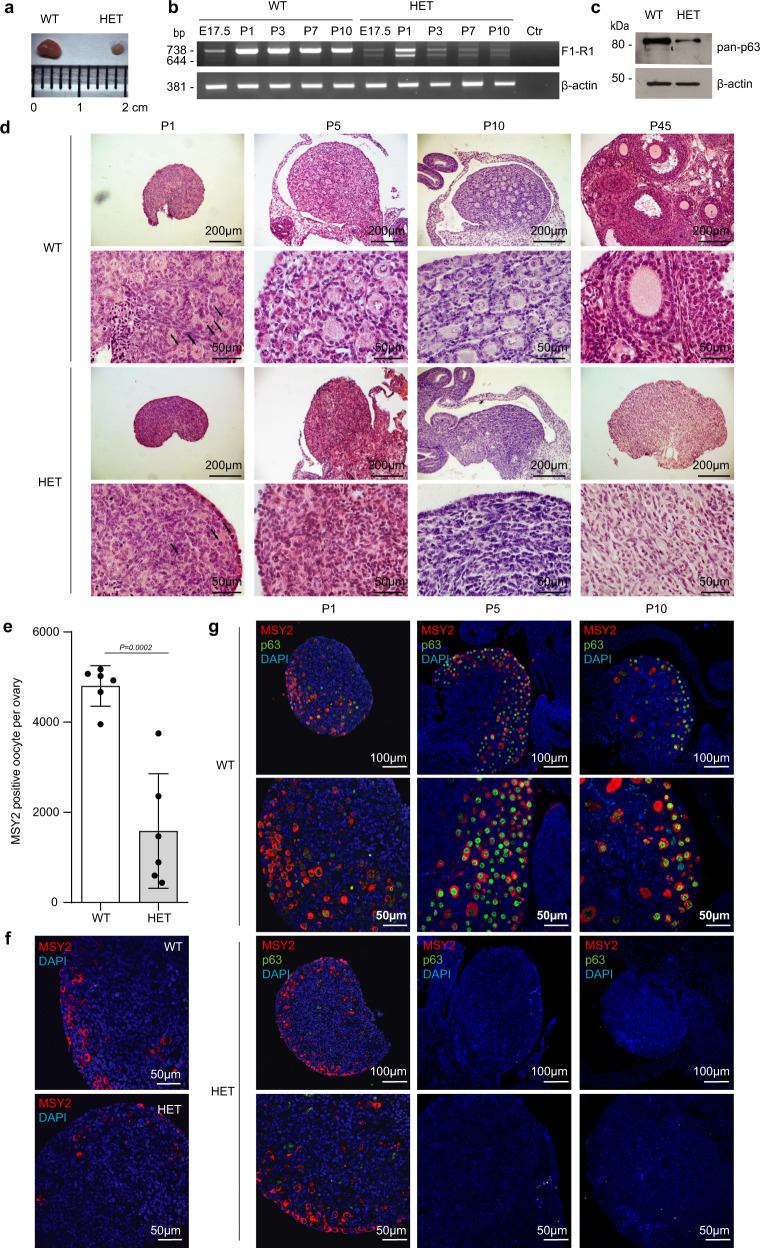
Fig. 2. Characterization of Δ13p63 heterozygous mouse ovaries.
a P45 WT and HET Δ13p63 (indicated as HET in figure) ovary size; b Semi-quantitative PCR analysis of p63α and p63β isoforms expression E17.5, P1, P3, P7, and P10 ovaries of WT and HET mice. β-actin was used as housekeeping gene for normalization. Ctr indicates a no-template PCR; c WB analysis of p63 isoforms expression in protein extracts of P1 ovaries of WT (n = 3) and HET (n = 3) mice. β-actin was used as a loading control; d Haematoxylin and eosin staining at P1, P5, P10, and P45 (1, 5, 10, and 45 day post-partum, P) ovary sections of WT and HET mice. The panels on the right side are magnifications of areas of the panels on the left side. Arrows indicate oocytes; e MSY2 positive cell count/ovary; WT (n = 6) and HET (n = 6) ovaries. Data are presented as mean ± SD, p-value by two-tailed unpaired Student’s t-test; f Oocytes IF staining for MSY2 (red) in P1 ovary sections of WT and HET mice; g MSY2 and p63 co-staining of P1, P5, and P10 ovary sections of WT and HET mice. The panels on the right are magnifications of areas of the panels on the left side. The images shown are representative of all the experiments performed (at least n = 6) Source data are provided as a Source Data file.

