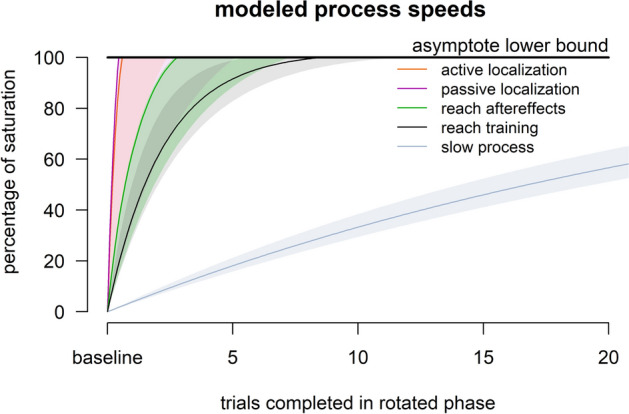
Figure 4.

Overview of Results. For each of the five processes considered in the paper, the plot shows the change from baseline (0%) to the lower limit of the 95% confidence interval of the asymptote (100%). For the reach adaptation and the two-rate model’s slow process, the highest rate of change is used. As is clear, the measures of implicit adaptation (reach aftereffects and hand localization shifts) are faster than adaptation and much faster than the model’s slow process.
