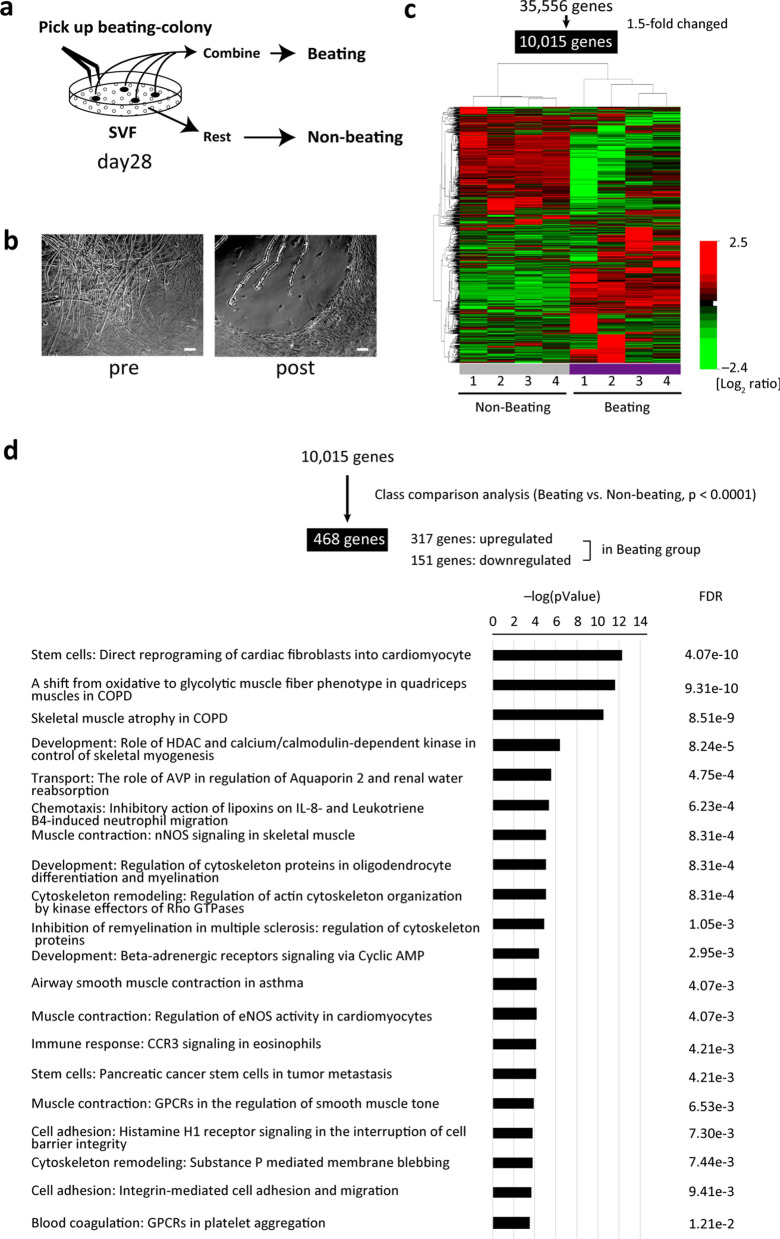
Figure 2.
Global transcriptome analysis of SVF beating cell clusters. (a) Schematic of RNA extraction from beating (beat) and non-beating (non-beat) cells. (b) Phase-contrast images of a beating cell cluster before (pre) and after (post) being picked-up. Scale bar, 100 µm. (c) Heatmap image of microarray data clustered using an unsupervised learning method, showing DEGs between beating and non-beating SVF cells using 10,015 prefiltered genes (under the condition that at least one expression value is at least 1.5-fold changed in either direction from the median value; n = 4 per group). The scale extends from 0.19- to 5.7-fold over the median (–2.4 to + 2.5 on a log2 scale). Red indicates increased expression, whereas green indicates decreased expression. The graphical image of heatmap was generated using BRB Array Tools software (v. 4.6.0) (NIH, Bethesda, MD, USA) (URL: https://brb.nci.nih.gov/BRB-ArrayTools/). (d) Gene pathways altered in the beating group among 468 genes extracted by class comparison analysis (p < 0.0001) from 10,015 prefiltered genes (FDR: 10−7 to 0.002). FDR, false discovery rate.

