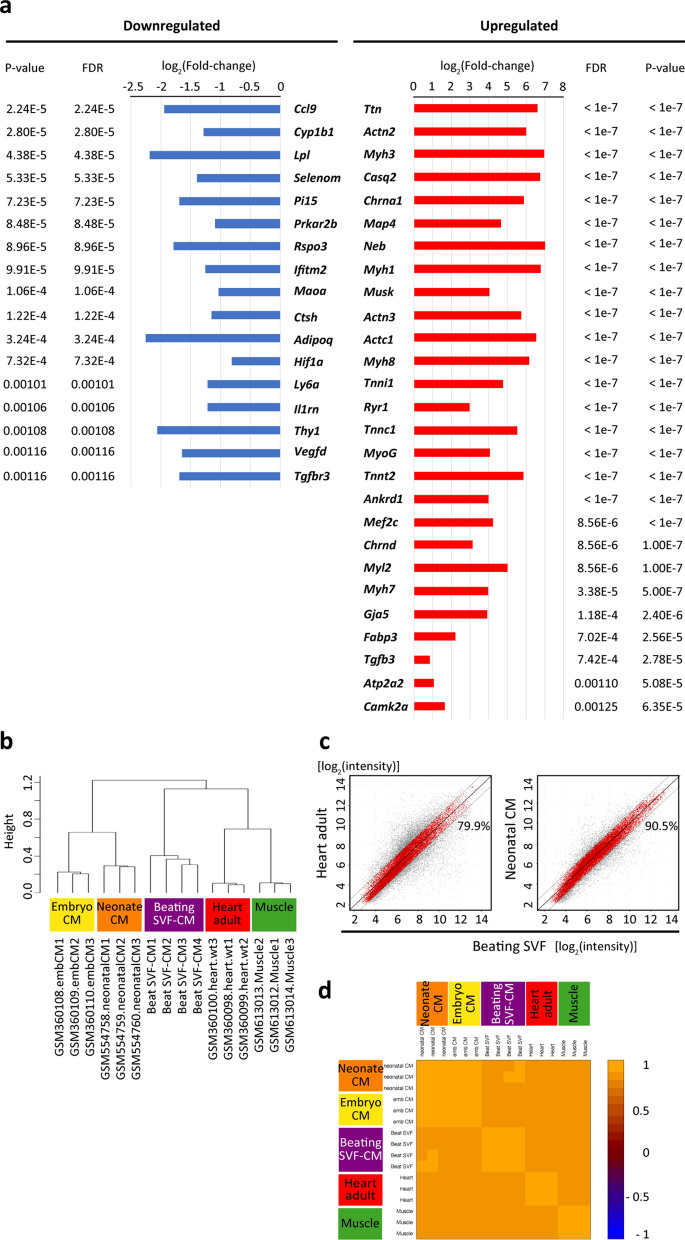
Figure 3.
Global gene expression profile in beating clusters of SVF. (a) Primary genes up- and downregulated in the beating compared to the non-beating group among 468 genes extracted by class comparison analysis (p < 0.0001) from 10,015 prefiltered genes (FDR: 10−7 to 0.002). FDR, false discovery rate. (b) Hierarchical clustering analysis of 32,000 genes (genes with a log-ratio variation in the 10th percentile were excluded) using an unsupervised learning method, compared with the SVF group based on array (Affymetrix Mouse Gene 1.0 ST Array) data from the gene expression omnibus database (NIH; Table S2). (c) Scatterplot of gene expression [log2(intensity)] between beating SVF and adult heart or neonatal cardiomyocytes. Genes with a ≤ twofold difference in expression are shown in red and the ratios to all genes are indicated. (d) Image plot of pairwise Pearson correlation of expression of arrays of beating SVF comparing to neonatal cardiomyocytes, embryo cardiomyocytes, adult heart, and skeletal muscle. The arrays are ordered based on hierarchical clustering using the average linkage method. Colours indicate the correlation coefficients. The graphical images of hierarchical clustering (b), scatter plot (c), and image plot (d) were generated using BRB Array Tools software (v. 4.6.0) (NIH, Bethesda, MD, USA) (URL: https://brb.nci.nih.gov/BRB-ArrayTools/).

