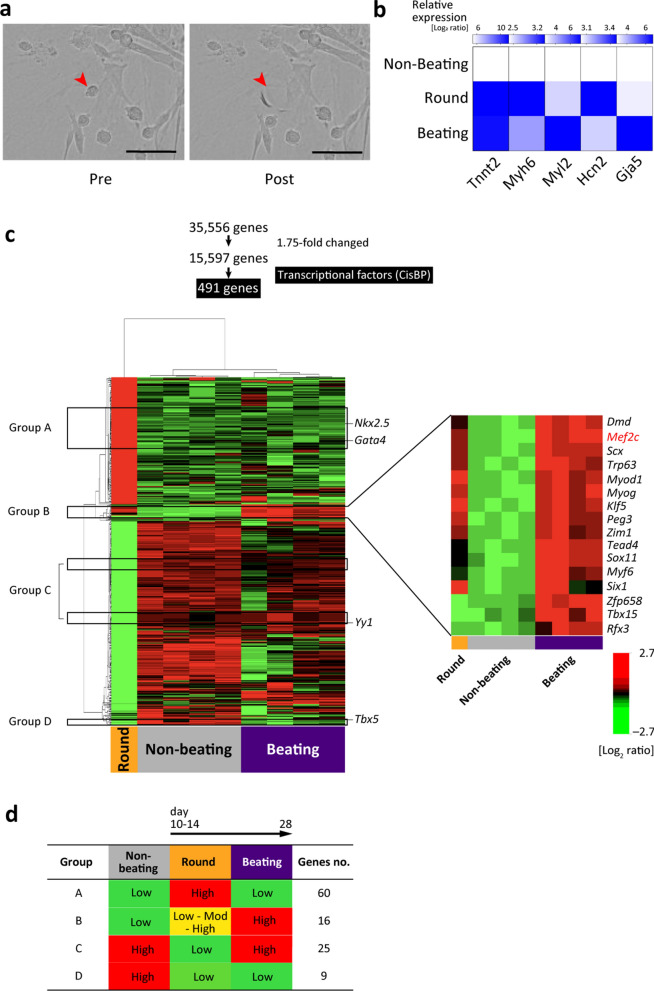
Figure 5.
Single cell-based analysis of round cells, which appear at ~ day 14 and transdifferentiate into beating CMs. (a) Representative phase-contrast images of a round cell (red arrowhead) before (pre) and after (post) being picked-up using the ALS CellCelector. Scale bar = 100 µm. (b) Relative expression levels of representative cardiac-specific genes. Colours indicate log2 ratios. (c) Heatmap of microarray data showing 491 differentially expressed transcription factors in the round, non-beating, and beating groups using 15,597 prefiltered genes (under the condition that at least one expression value has a ≥ 1.75-fold change in either direction from the median value; n = 4 in the non-beating and beating group versus n = 1 in the round cell group. The round cell group constituted the combined product of six isolated cells). Among 491 genes, four groups of transcription factors (A to D) were selected (black boxes). Group B is magnified, and the key genes are indicated at right. The scale extends from 0.15- to 6.5-fold over the median (–2.7 to + 2.7 in log2 scale). Red indicates increased expression, and green indicates decreased expression. (d) Alterations of gene expression and numbers of genes are shown. The graphical images of expression panel (b) and heatmap (c) were generated using BRB Array Tools software (v. 4.6.0) (NIH, Bethesda, MD, USA) (URL: https://brb.nci.nih.gov/BRB-ArrayTools/).

